Fig. 3.
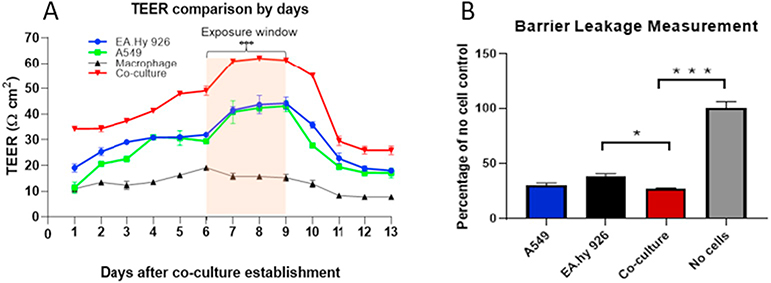
Transepithelial electrical resistance (Ohms/cm2) was measured for the A549, EA.hy 926 cells and co-culture from day 1 to day 13 (A). All groups showed an increase in TEER up to day 6. From day 7 to day 9, the co-culture had stable resistance that was higher compared to the individual cell types. This increase was statistically significant (P < 0.05). Paracellular permeability was measured using sodium fluorescence tracer solution on day 9 in epithelial and endothelial cell lines as well as in co-culture (B). A group of no-cell controls was used to compare the amount of permeable fluorescence between each experimental group. Cell layers provided a significant level of blockage. The data were presented as mean ± S.D. * indicates P < 0.05; *** indicates P < 0.001.

