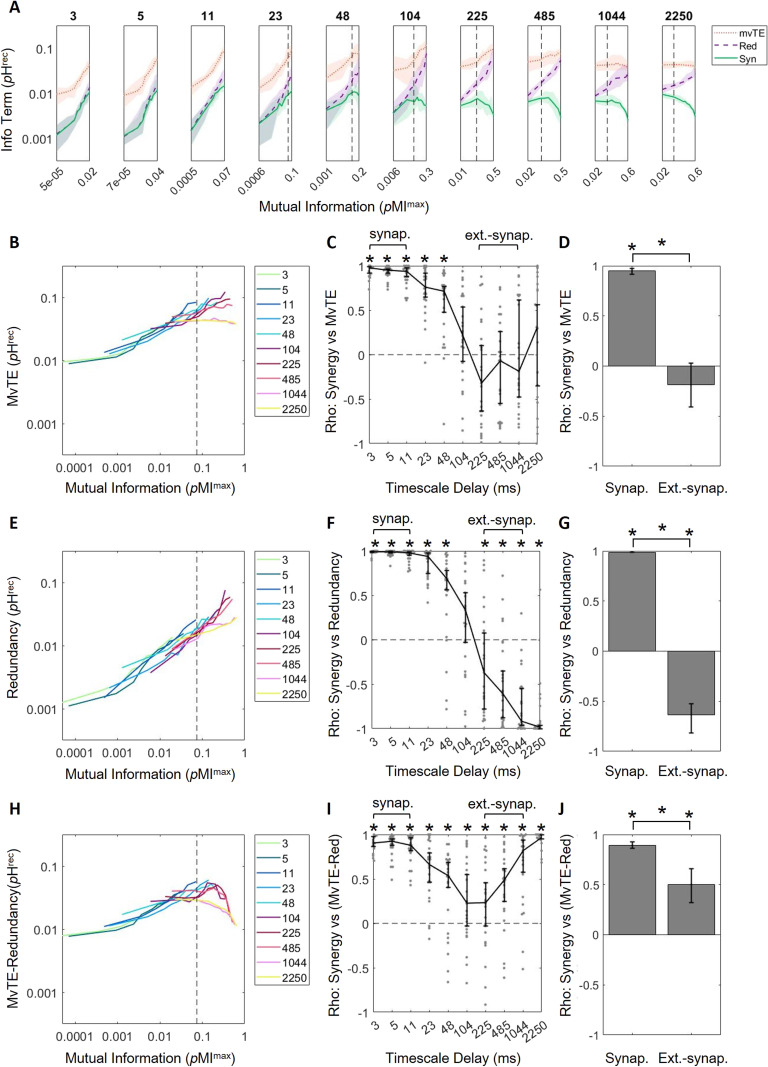
Figure 5. .
Redundancy encroaches upon multivariate transfer entropy at longer timescales, accounting for decreasing synergy at those timescales. (A) Log-scaled multivariate transfer entropy (mvTE), redundancy (Red), and synergy (Syn) versus mutual information, for all timescales. Growth of mvTE with respect to mutual information is steep at short timescales, but decreases across timescales. Redundancy grows with mutual information at all timescales. (B) MvTE curves in A plotted on the same axes. (C) Spearman rank correlation coefficients of synergy versus mvTE across timescales indicates that mvTE saturates at longer timescales. (D) Synergy and mvTE are significantly positively related at synaptic timescales, but not at extrasynaptic timescales. (E) Redundancy curves in A plotted on the same axes. (F) Spearman rank correlation coefficients of synergy versus redundancy across timescales shows how the two are positively related at shorter timescales and negatively related at longer timescales. (G) Synergy and redundancy are significantly positively related at synaptic timescales and significantly negatively related at extrasynaptic timescales. (H) Difference of MvTE and redundancy curves in A plotted on the same axes shows that the overall trend looks most similar to that of synergy versus mutual information in Figure 4E. (I) Spearman rank correlation coefficients of synergy versus mvTE redundancy across timescales shows that the two are positively related at all timescales. (J) Synergy and mvTE redundancy are significantly positively related at synaptic and extrasynaptic timescales. Synergy versus mutual information data has been replotted from Figure 4D here in A for ease of comparison. For all plots, solid/bold lines indicate medians and shaded regions/error bars depict 95% bootstrap confidence intervals around the median.

