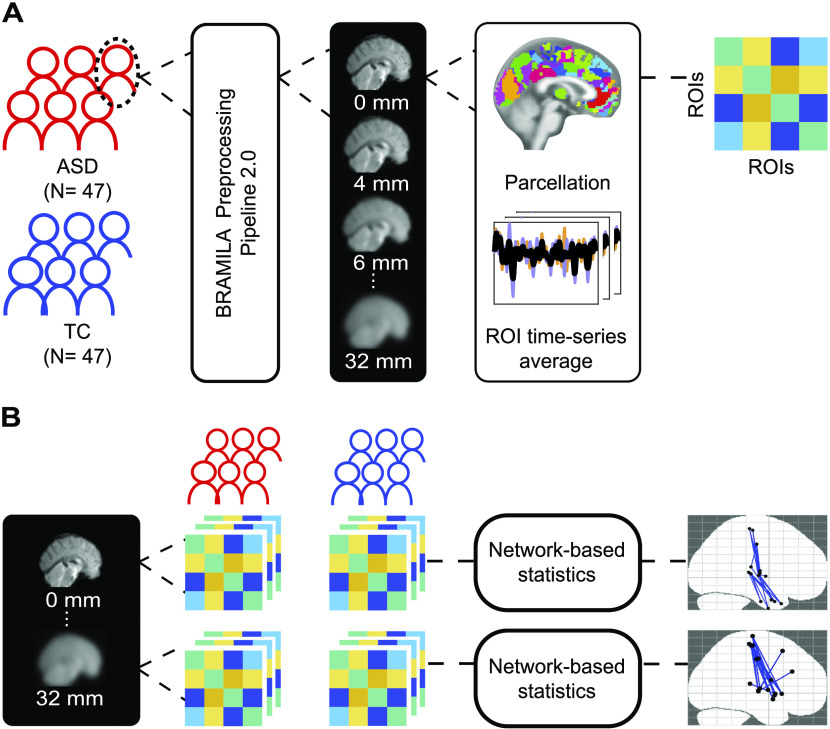
Figure 1. .
Outline of data preprocessing and detection of network differences. (A) Subjects are divided in two groups according to their diagnosis: autism spectrum disorder (ASD) or typical controls (TC). For each subject, functional networks are constructed by applying a series of steps. First, the fMRI data is preprocessed using a standard preprocessing pipeline (Power et al., 2014; and FSL) without applying spatial smoothing (FWHM = 0 mm). Next, the images are smoothed with 16 different kernels, starting from 4 mm and increasing in 2-mm steps; data with no additional smoothing are also included (FWHM = 0 mm). Then, for each of these images, we average the voxel time series according to the regions of interest (ROIs). Finally, we calculate the connectivity matrix as Pearson correlations between the averaged ROI time series. This process yields one connectivity matrix per subject per smoothing kernel. (B) The matrices are organized according to the subjects’ diagnosis for each smoothing kernel. This grouping creates 16 models that are individually fed to the network-based statistics (NBS) toolbox (Zalesky et al., 2010) to investigate the group-level differences in functional networks for each level of spatial smoothing.

