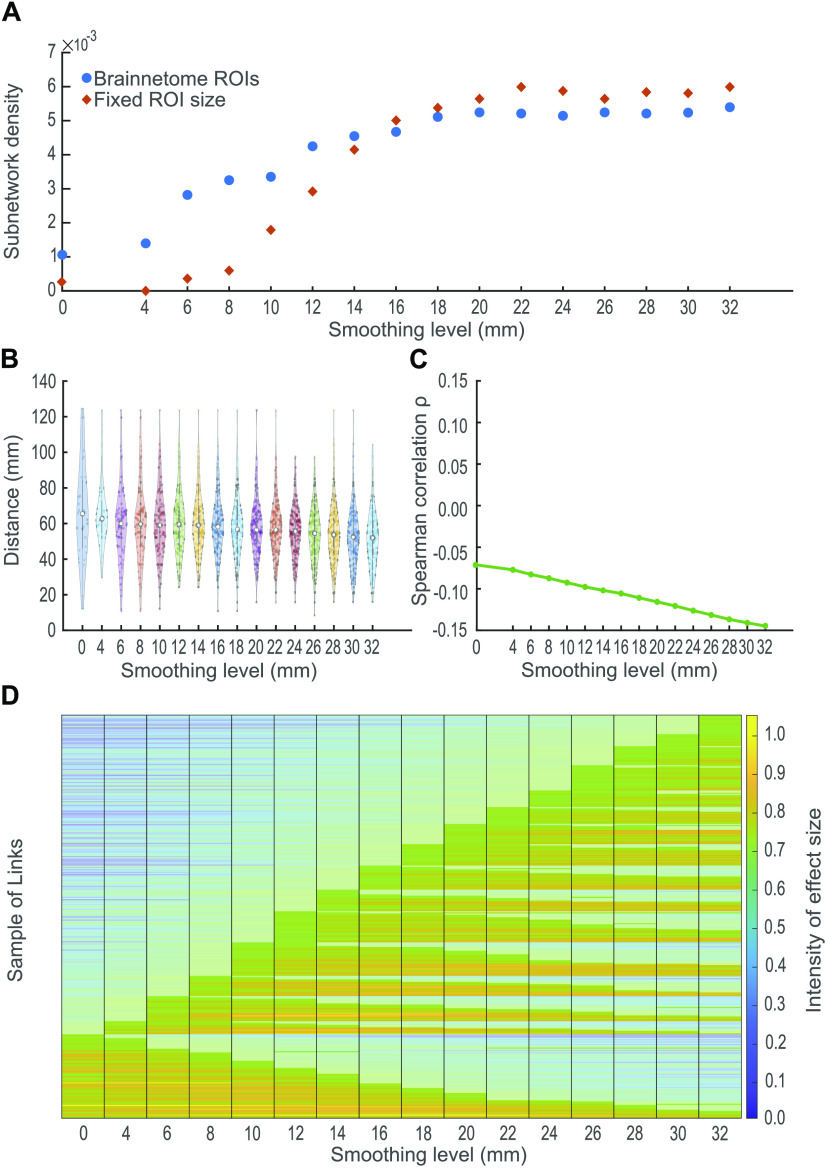
Figure 3. .
Characteristics of between-group differences for each smoothing kernel. Based on the subnetworks identified by NBS, we see the following: (A) The choice of smoothing kernel affects the number of links of the subnetworks, and its effects are independent of ROI size. The number of links in the subnetwork increases as the smoothing level is incremented. This pattern is present even when the ROIs are artificially constructed as spheres of constant ratios. (B) Spatial smoothing alters the distance profile of detected links at commonly used kernels FWHM ≤ 12 mm with shorter links being undetected at kernels 4 mm and 12 mm. (C) Larger kernels are associated with a decrease in the detection of longer links. A decline in the value of ρ with increasing FWHM highlights a stronger negative correlation between the length of the links and their F statistic. In other words, using larger kernels decreases the chance of finding long links. (D) Effect sizes of the subnetwork links change depending on the smoothing kernel. The y-axis shows the links that NBS identified as different between groups at some kernel. The links (y-axis) are organized according to the smallest kernel in which they are detected and the number of smoothing levels in which they appear statistically significant (α < 0.05); for example, all links that are significant at 0 mm are shown at the bottom of the plot, then on top of them, we show all links that are significant at 4 mm, but that are not significant at 0 mm. This organization follows until all smoothing levels are shown. The plot highlights those kernels at which the links are found significant. Six links are detected at all smoothing levels. Conversely, some links are observed only when a particular kernel is used despite having a large effect at other kernels.

