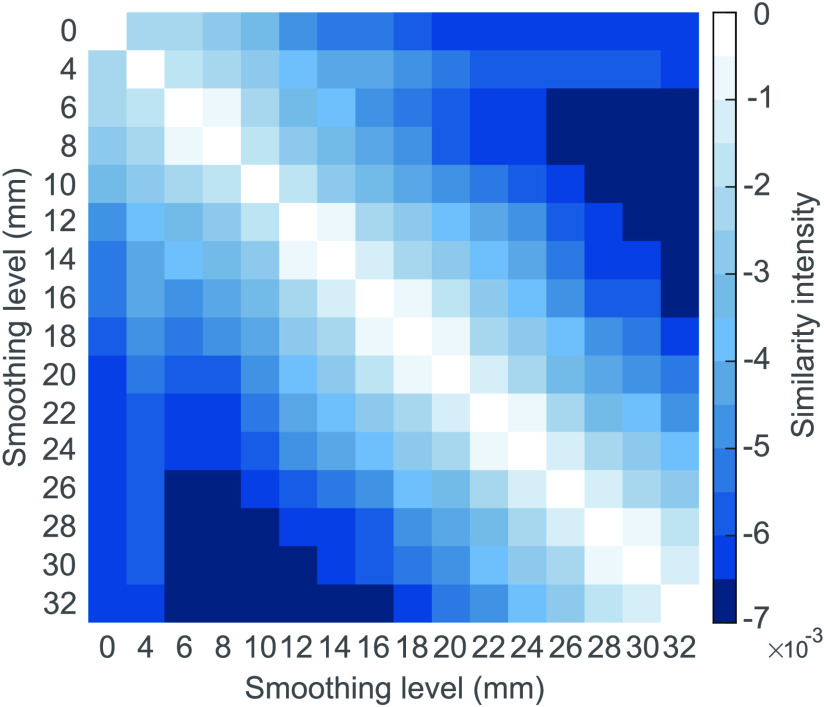
Figure 4. .
Similarity matrix between the identified subnetwork differences at each smoothing level. Brighter colors represent fewer differences in the structure of the subnetworks. Subnetwork pairs 6–8 mm, 12–14 mm, 16–18 mm, 18–20 mm, 22–24 mm, and 28–30 mm are more similar than the rest of kernels.

