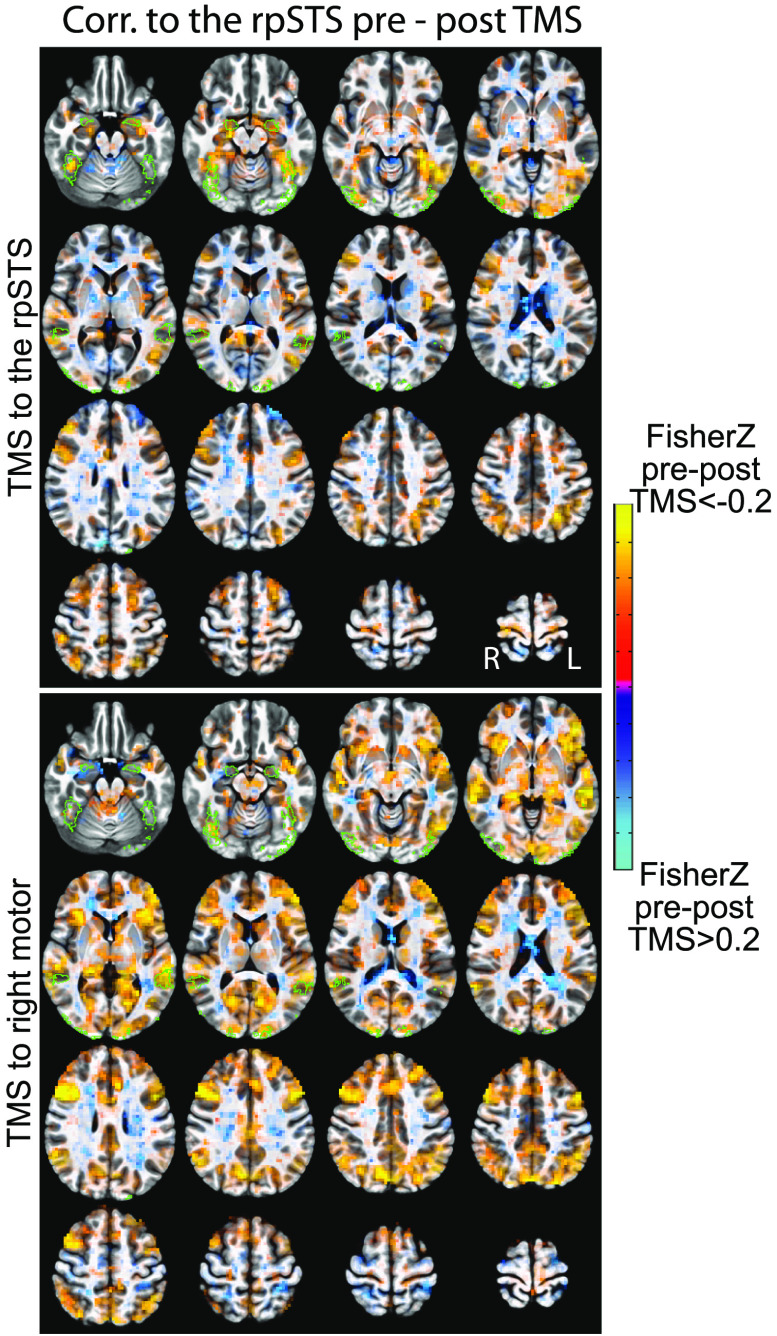
Figure 3. .
Whole-brain correlation changes (Fisher Z transformed) pre- and post-TBS stimulation. Voxel coloring shows the magnitude of the correlation difference. Voxels are opaque for p > = 0.01 to transparent for p = 0 The green outlines are voxels in the ROIs of the predefined face network in at least three volunteers. For TMS to the rpSTS, many of the larger signal drops are within the face network ROIs. TMS to right motor shows decreases across more of the brain that is not localized to the face network.

