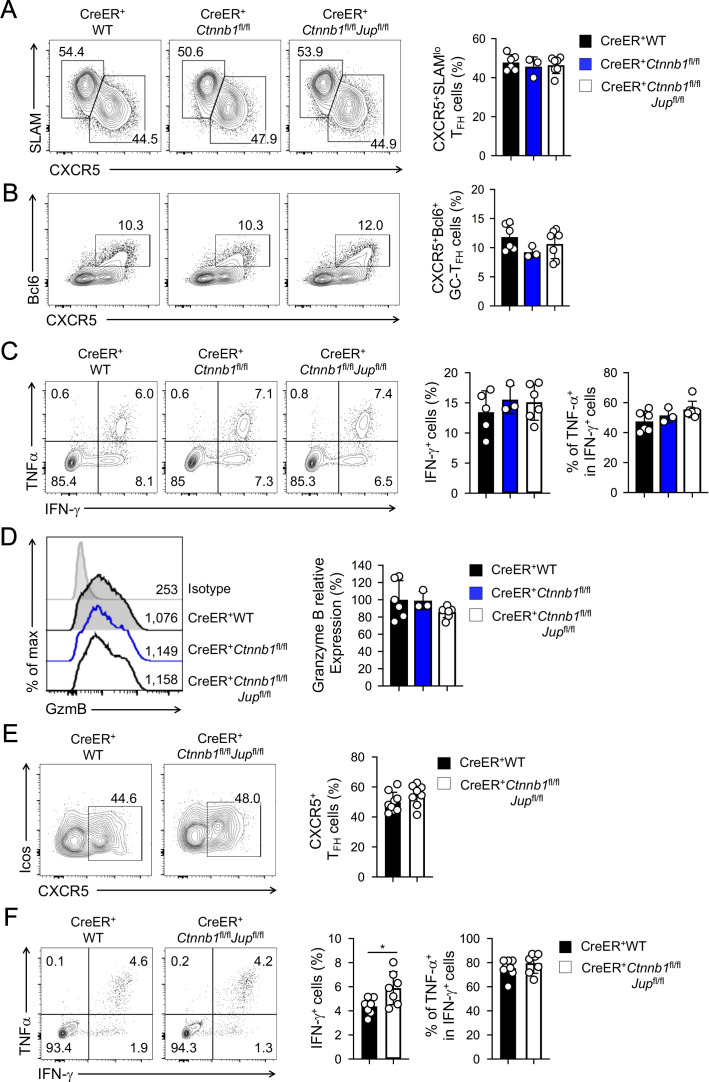
Figure 2. β-catenin and γ-catenin are not required for T cell responses to acute viral infection.
BM chimeras were established and treated with tamoxifen as in Figure 1C, and infected with LCMV. The infected mice were analyzed on eight dpi for effector (A–D) and ≥40 dpi for memory phase responses (E, F). (A) Detection of CXCR5+SLAMlo TFH and CXCR5–SLAMhi TH1 cells in CD45.2+ CD44hiCD62L– activated CD4+ splenocytes on eight dpi by cell surface staining. (B) Detection of CXCR5+Bcl6+ GC-TFH cells in CD45.2+ CD44hiCD62L– activated CD4+ splenocytes on eight dpi by intranuclear staining. (C) Detection of IFN-γ and/or TNF-α-producing cells in CD45.2+CD8+ splenocytes on eight dpi by intracellular staining after 5 hr incubation with GP33 peptides. (D) Detection of granzyme B expression in CD45.2+ CD11ahi activated CD8+ splenocytes on eight dpi by intracellular staining. Values in half-stacked histograms denote geometric mean fluorescence intensity (gMFI). (E) Detection of CXCR5+ memory TFH cells in CD45.2+CD44hi antigen-experienced CD4+ splenocytes on ≥40 dpi by cell surface staining. (F) Detection of IFN-γ and/or TNF-α-producing memory CD8+ T cells in CD45.2+CD8+ splenocytes on ≥40 dpi by intracellular staining after 5 hr incubation with GP33 peptides. In all panels, values in representative contour plots denote percentages, and cumulative data are means ± s.d. from two experiments. *, p<0.05 by Student’s t-test; all other unmarked parameters were not statistically significant among the groups as determined by one-way ANOVA (A–D) or Student’s t-test (E, F).

