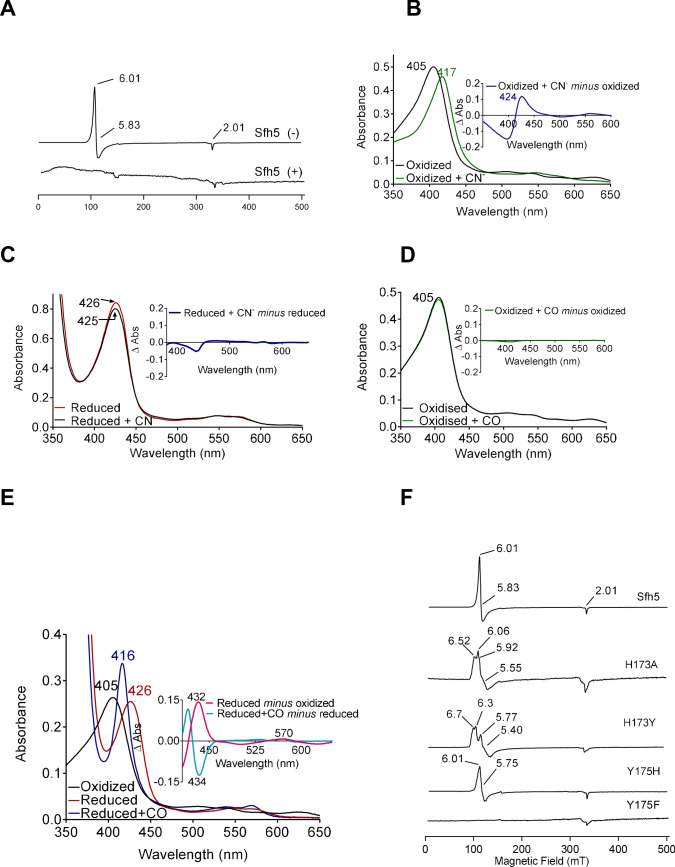
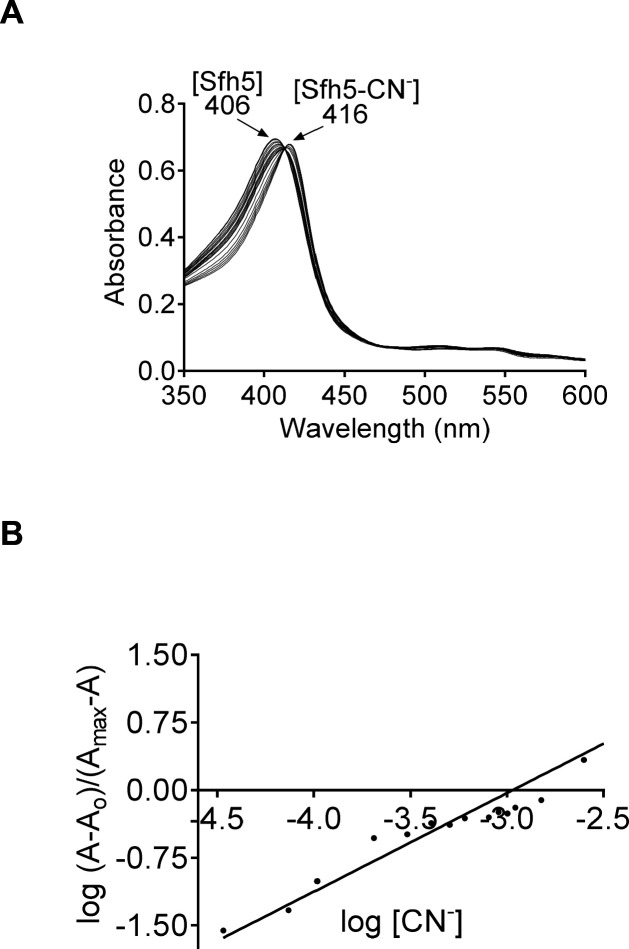
Figure 5. Electronic properties of the Sfh5 Fe-center.
(A) EPR spectra of purified Sfh5 before (-) and after dithionite treatment (+). (B) UV-visible absorption spectrum of purified (oxidized) Sfh5 without and with treatment with potassium ferricyanide as source of cyanide ion (CN-) (Blumenthal and Kassner, 1980). Inset shows the difference spectrum between the two conditions and highlights a significant red shift in the Soret maximum induced by CN-. (C) Purified Sfh5 was first reduced with excess dithionite and spectra were taken before and after incubation in the presence of CN-. Inset indicates the difference spectrum between the two conditions and shows no appreciable shift in the Soret maximum. (D) UV-vis spectra before and after incubation of purified Sfh5 with carbon monoxide (CO) gas are shown. Inset indicates the difference spectrum between the two conditions and shows no shift in the Soret maximum in the presence of CO. (E) UV-vis spectra of purified Sfh5 reduced with dithionite and incubated in the presence of CO. Inset, difference spectra as indicated. (F) EPR spectra of purified Sfh5, Sfh5H173A, Sfh5H173Y, Sfh5Y175H, and Sfh5Y175F are shown. Protein samples were normalized by concentration (150 μM).


