. 2020 Sep 1;9:e57282. doi: 10.7554/eLife.57282

Figure 5. Effect of CMT organisation on pollen tube path.

(A) Confocal images of papilla cells expressing MAP65.1-citrine in Col-0 and ktn1-5 at stage 13. Scale bars, 5 μm. (B) SEM images of Col-0 and ktn1-5 papillae pollinated with Col-0 pollen grains. Scale bar, 10 μm. (C) CMT anisotropy of Col-0 and ktn1-5 papilla cells at stage 13. N(Col-0)=10 stigmas, n(Col-0)=106 papillae, N(ktn1-5)=11 stigmas, n(ktn1-5)=114 papillae. Statistical differences were calculated using a Shapiro-Wilk test to evaluate the normality and then a Wilcoxon test with ***p<0.01. (D) Quantification of the number of turns (T) made by Col-0 pollen tubes on ktn1-5 and Col-0 papillae. Data are expressed as mean +/- s.e.m. Statistical difference was found between pollen tube path within ktn1-5 and Col-0 papillae and was calculated using an adjusted Chi-Square test for homogeneity (2 degrees of freedom), p<0.01. N(Col-0)=27 stigmas, n(Col-0)=251 papillae, N(ktn1-5)=23 stigmas, n(ktn1-5)=327 papillae. Figure 5—figure supplement 1 shows SEM images of the behaviour of Col-0 pollen tubes on Col-0 and ktn1-5 papillae at stage 13. Figure 5—figure supplement 2 illustrates the receptivity and fertility of the ktn1-5 mutant. Figure 5—figure supplement 3 shows that mutants impaired in cell wall genes behave like Col-0. Figure 5—figure supplement 4 gives the saccharide composition of Col-0, ktn1-5 and xxt1 xxt2 stigmatic cell walls. Figure 5—figure supplement 5 compares the length and width of papilla cells from Col-0, ktn1-5, xxt1 xxt2 and any1. Figure 5—source data 1 provides source data for the quantification of CMT anisotropy of Col-0 and ktn1-5 papilla cells at stage 13 shown in C, for the quantification of the number of turns made by Col-0 pollen tubes on ktn1-5 and Col-0 papillae shown in D, and source data for the Figure 5—figure supplement 2, Figure 5—figure supplement 3 and Figure 5—figure supplement 4. Figure 5—source data 2 provides information on the six cell wall genes analysed and shows that they are expressed in stigmas.
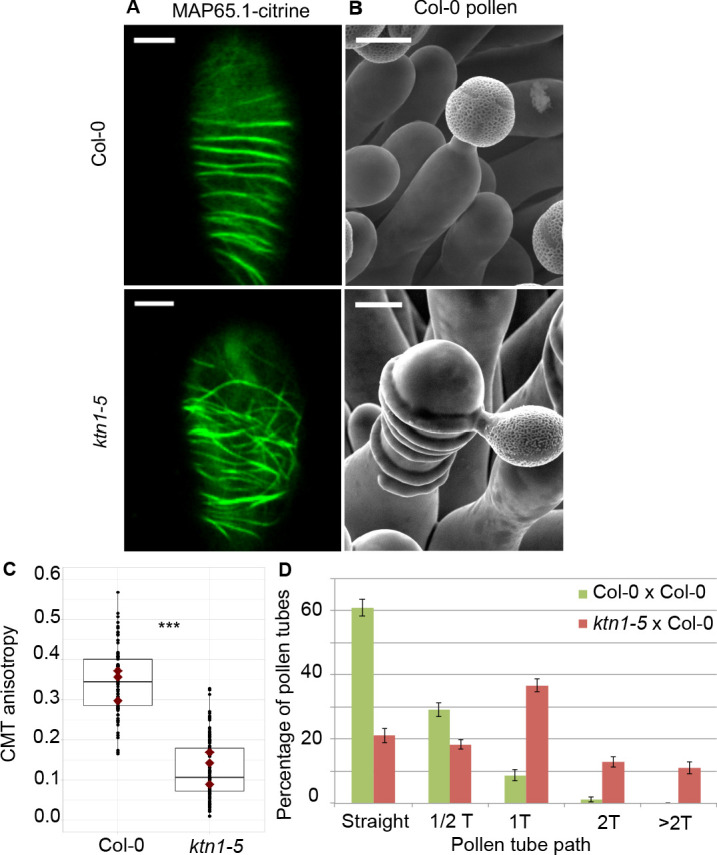
Figure 5—source data 1. Source data for the quantification of CMT anisotropy of Col-0 and ktn1-5 papilla cells at stage 13 shown in Figure 5C and the quantification of the number of turns made by Col-0 pollen tubes on ktn1-5 and Col-0 papillae shown in Figure 5D.
Figure 5—source data 2. Table of cell wall mutants analysed.

Figure 5.

Figure 5—figure supplement 1. Col-0 pollen tube behaviour on Col-0 and ktn1-5 papillae at stage 13.

Figure 5—figure supplement 1.

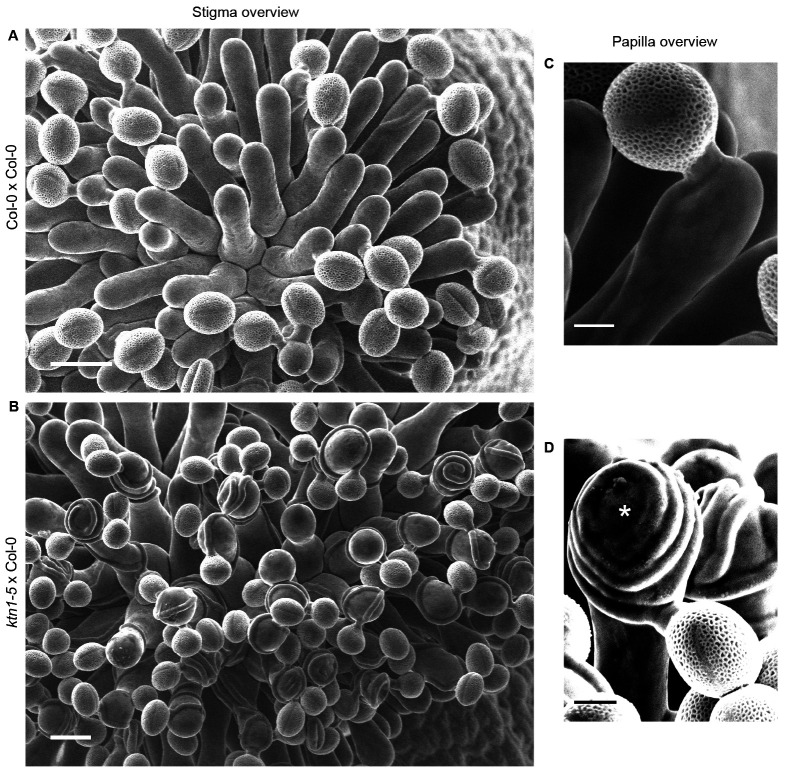
(A and B) Top views of Col-0 (A) and ktn1-5 (B) stigmas pollinated with Col-0 pollen grains. Scale bars, 20 µm. (C and D) Magnification of pollinated papilla cells. (C) Col-0 pollen tube grows mainly straight to the direction of the ovules on Col-0 papillae whereas (D) it coils around and can even grow upward on ktn1-5 papilla cells (*). Scale bars, 5 µm.
Figure 5—figure supplement 2. ktn1-5 is impaired in female receptivity and fertility.

Figure 5—figure supplement 2.

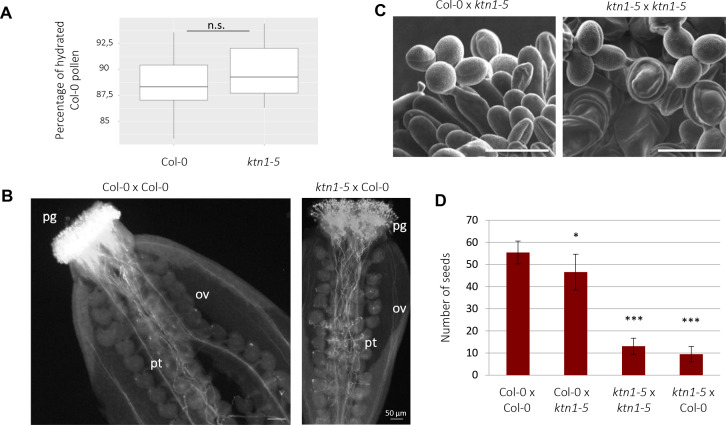
In all crosses, the female partner is written first. (A) Stigma receptivity: percentage of Col-0 hydrated pollen grains on Col-0 and ktn1-5 stigmas (N = 10 stigmas for each genotype, with 972 pollen grains analysed for Col-0 and 1959 for ktn1-5). Calculations were based on pollen shape (round-shape pollens = hydrated, oval-shaped = not hydrated). n.s: not significantly different. (B) Aniline blue staining of Col-0 and ktn1-5 pistils pollinated with Col-0 pollen grains after 6 hr. pg = pollen grain, pt = pollen tube, ov = ovule. N > 10 stigmas each. (C) ktn1-5 pollen tubes grow like Col-0 pollen on Col-0 papilla cells but coil on ktn1-5 stigma papillae. Scale bars, 30 μm. (D) Seed set. N ≥ 7 siliques each. Statistical differences were tested with a T-test, *<0.05 and ***<0.01, by comparing each cross to Col-0 x Col-0.
Figure 5—figure supplement 3. Quantification of the number of coils made by Col-0 pollen tubes on papillae from cell-wall mutants at stage 13.

Figure 5—figure supplement 3.

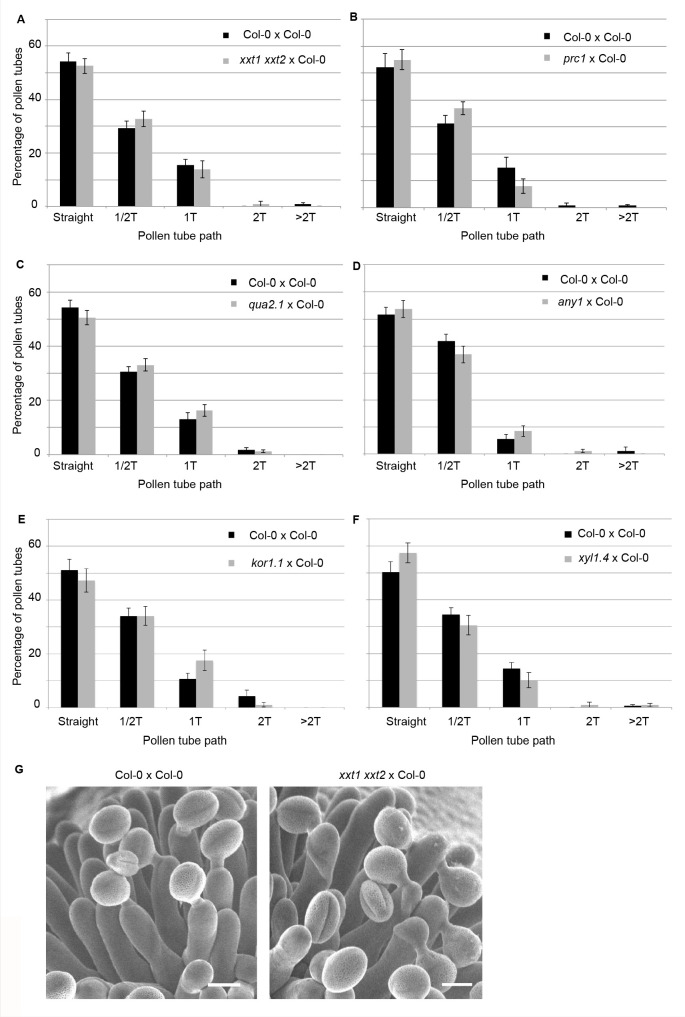
(A) xxt1 xxt2 x Col-0. N(Col-0)=14 stigmas, n(Col-0)=116 papillae, N(xxt1 xxt2)=12 stigmas, n(xxt1 xxt2)=116 papillae. (B) prc1 x Col-0. N(Col-0)=14 stigmas, n(Col-0)=115 papillae, N(prc1)=12 stigmas, n(prc1)=100 papillae. (C) qua2.1 x Col-0. N(Col-0)=22 stigmas, n(Col-0)=160 papillae, N(qua2.1)=18 stigmas, n(qua2.1)=162 papillae. (D) any1 x Col-0. N(Col-0)=14 stigmas, n(Col-0)=91 papillae, N(any1)=14 stigmas, n(any1)=95 papillae. (E) kor1.1 x Col-0. N(Col-0)=14 stigmas, n(Col-0)=141 papillae, N(kor1.1)=11 stigmas, n(kor1.1)=91 papillae. (F) xyl1.4 x Col-0. N(Col-0)=18 stigmas, n(Col-0)=136 papillae, N(xyl1.41)=16 stigmas, n(xyl1.4)=108 papillae. Data are expressed as mean +/- s.e.m. No statistical difference was found between pollen tube path within the cell wall mutants and Col-0 papillae based on an adjusted Chi-Square test for homogeneity (2 degrees of freedom). (G) SEM images of Col-0 and xxt1 xxt2 stigmas pollinated with Col-0 pollen grains. Scale bar, 10 µm.
Figure 5—figure supplement 4. Cell wall composition is altered in katanin1 and different from xxt1 xxt2.

Figure 5—figure supplement 4.

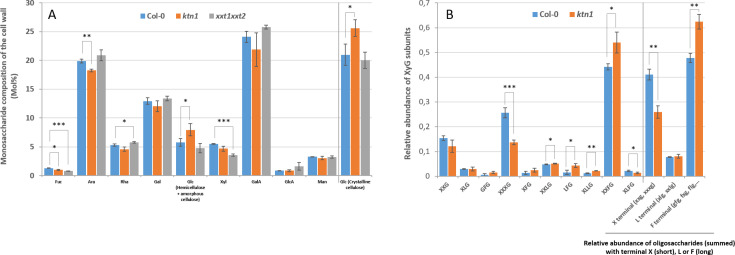
(A) Relative abundance of monosaccharides in the cell wall extracted from pistils of Col-0, ktn1, xxt1 xxt2. (B) MALDI-TOF analysis of xyloglucan from dissected stigmas of Col-0 and ktn1 (xxt1 xxt2 does not produce XyG with side chains). Single-letter nomenclature (Fry et al., 1993) is used to describe the oligosaccharides where X = backbone glucose substituted with a terminal xylose, L = substituted with β-D-galactose, F = substituted with fucose, and G = unsubstituted. Mean values represent acetylated and nonacetylated subunits of XXLG, XXFG, and XLFG combined. The relative abundance of total oligosaccharides with terminal xylose, terminal galactose or terminal fucose on their side chains has been calculated. Data represent the mean of 3 biological replicates, error bars represent the standard deviation, statistical differences were calculated using a T-test.* p<0.05, **p<0.01, ***p<0.001.
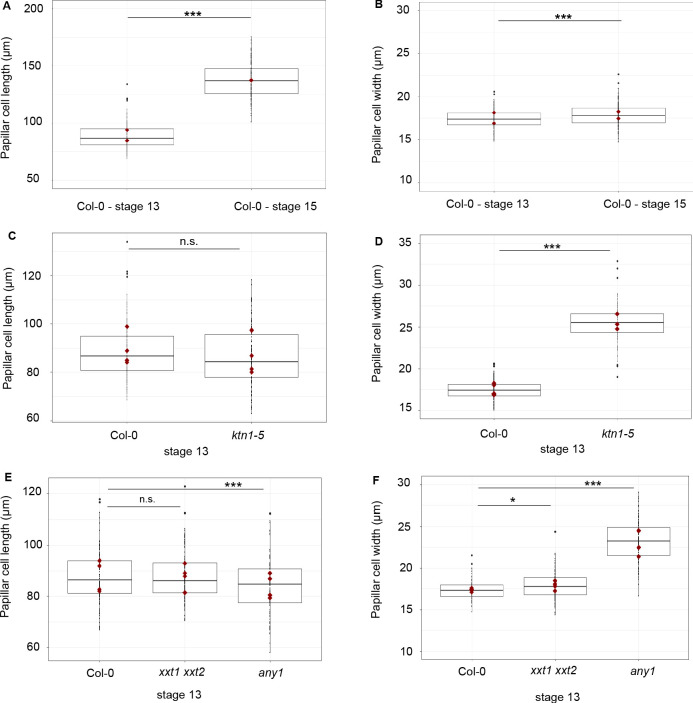
Figure 5—figure supplement 5. Size of the papilla cells of Col-0 and cell wall mutants.

Figure 5—figure supplement 5.

(A) Papilla cell length of Col-0 at stage 13 and stage 15. (B) Papilla cell width of Col-0 at stage 13 and stage 15. (C) Papilla cell length of Col-0 and ktn1-5 at stage 13. (D) Papilla cell width of Col-0 and ktn1-5 at stage 13. (E) Papilla cell length of Col-0, xxt1 xxt2 and any1 at stage 13. (F) Papilla cell width of Col-0, xxt1 xxt2 and any1 at stage 13. Statistical differences were calculated using a T-test. *p<0.05, ***p<0.01, n.s. = not significant. N = 4 stigmas and n = 120 papillae for each genotype.