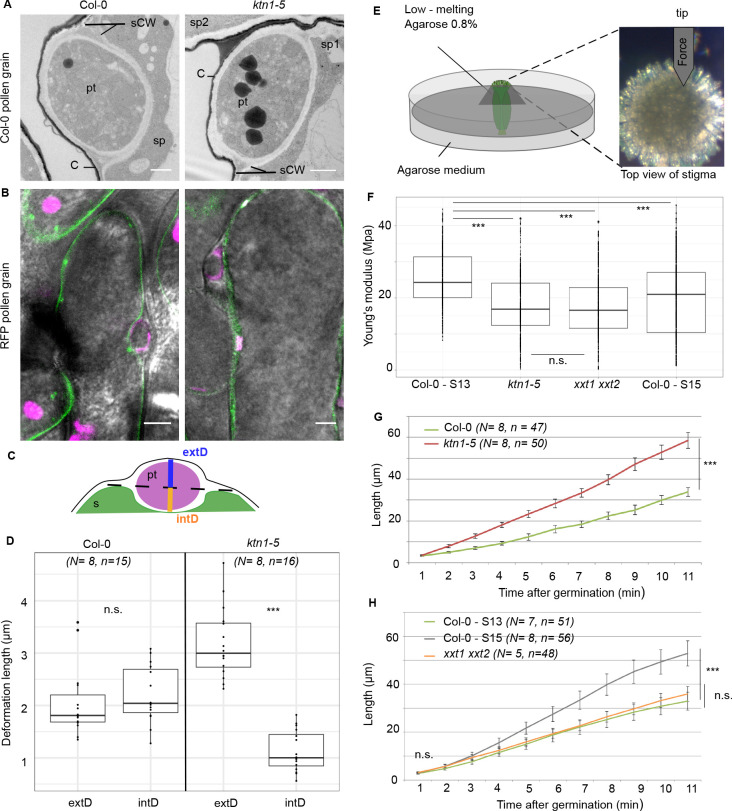
Figure 6. Mechanical properties of papilla cell walls.
(A) Location of a Col-0 pollen tube in the cell-wall of Col-0 and ktn1-5 papillae by TEM. pt = pollen tube, C = stigma cuticle, sCW = stigma cell wall, sp = stigma papilla. Scale bar, 1 μm. (B) Confocal images of Col-0 and ktn1-5 papillae expressing the plasma membrane marker LTI6B-GFP pollinated with an RFP-expressing pollen. Scale bar, 5 μm. (C) Diagram showing the procedure used for evaluating the external (extD) and internal (intD) deformations made by Col-0 pollen tubes. (D) External and internal deformations caused by Col-0 pollen tube growth in Col-0 and ktn1-5 papillae. (E) Drawing of the AFM experimental setup. Dissected pistils were inserted in agarose medium and fixed with low-melting agarose for measurements. (F) Young’s modulus values of the papilla cell wall for Col-0 at stage 13 (N = 4 stigmas, n = 8 papillae), ktn1-5 (N = 5 stigmas, n = 9 papillae), xxt1 xxt2 (N = 4 stigmas, n = 11 papillae) and Col-0 at stage15 (N = 4 stigmas, n = 10 papillae. (G) Mean of travel distances made by Col-0 pollen tubes in Col-0 and ktn1-5 papillae. (H) Mean of travel distances made by Col-0 pollen tubes in papillae of Col-0 at stage 13, Col-0 at stage 15, xxt1 xxt2 at stage 13. D,F and G,H: Statistical differences were calculated using a Shapiro-Wilk test to evaluate the normality and then a T-test. ***p<0.01, n.s. = not significant. For H, we found a significant difference (***p<0.01) between Col-0 at stage 13 and 15, but not significant (n.s.) between Col-0 at stage 13 and xxt1 xxt2 at stage 13. Figure 6—figure supplement 1 shows the similar ultrastructural features of Col-0 and ktn1-5 papilla cell walls. Figure 6—source data 1 are values measured to define the mechanical properties of the papilla cell walls shown in D, F, G, H.
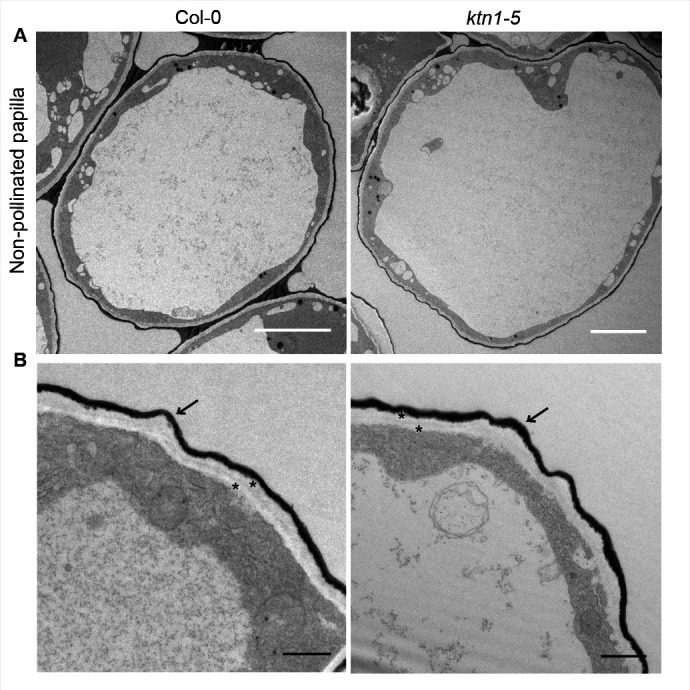
Figure 6—figure supplement 1. Ultrastructural features of Col-0 and ktn1-5 papilla cells.


