
Figure 2.
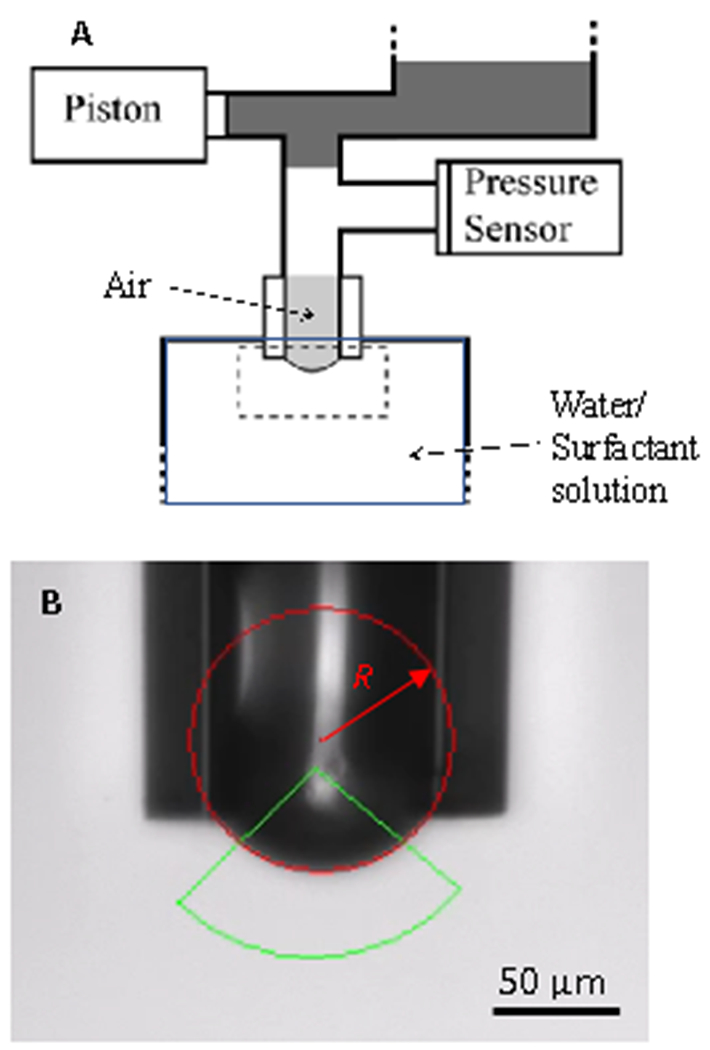
(A) Schematic diagram of the capillary pressure microtensiometer. An air bubble is held at the end of a hydrophobized glass capillary (See B) in a reservoir of surfactant solution in buffer. A pressure transducer measures the pressure within the bubble. Lysolipid in the solution reservoir spontaneously adsorbs to the bubble interface, quickly establishing an equilibrium capillary pressure, ΔPeq and bubble radius, Req. γeq is determined by Laplace’s equation ΔPeq = 2γeq / Req. Oscillating the capillary pressure via a syringe pump piston induces corresponding radius oscillations, ΔR, with a phase angle ϕRP between the pressure and radius oscillation. The dilatational modulus, ε, is calculated from Eqn. 2 using these measured parameters. The apparatus is controlled using LabVIEW.
(B) Bright field microscope image of the capillary containing the air bubble. The radius of the bubble is measured by fitting images of the bubble to a circle (red) over the region defined by the green triangle, to determine, R. Within the image resolution, the bubble is hemispherical up to the pinning line at the capillary tip and remains hemispherical during oscillations.