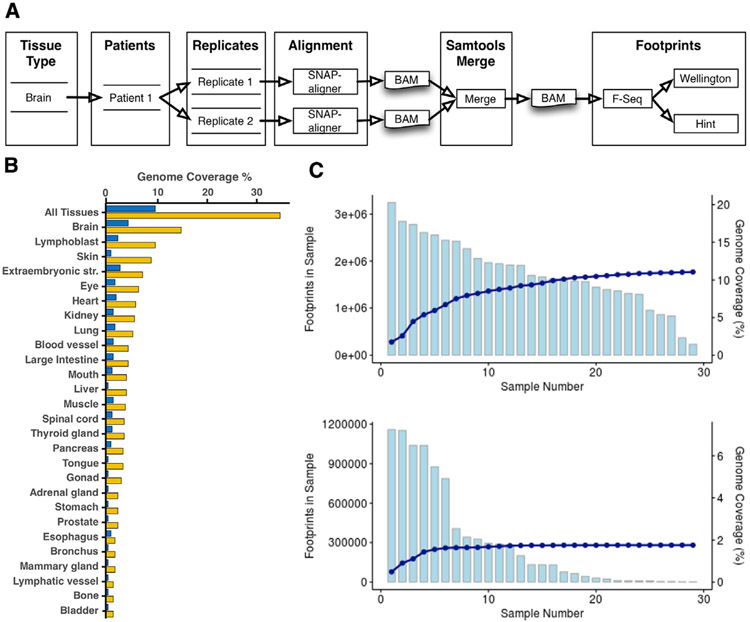
Figure 1. Footprint Atlas Workflow and Coverage Statistics.
(A) Footprints workflow overview. Each tissue type can have multiple quantities of patients and replicates. Each replicate is aligned using SNAP-aligner. All replicates for each patient are merged using Samtools. Finally, footprints for each BAM file are produced using Wellington and HINT and stored in a database.
(B) Percentage of the genome covered by the footprints for each tissue type and all tissues. Yellow is without filtering, and dark blue is filtering with HINT score > 200 and Wellington score < −27 (each method has its own scale and distribution).
(C) Footprints from the brain for HINT20 are ordered based on the number of footprints and summed. The light blue graphs represent the total number of footprints in each sample (top is without filtering on score; bottom is filtered as in B). The dark blue line represents the cumulative percentage of the genome covered.

