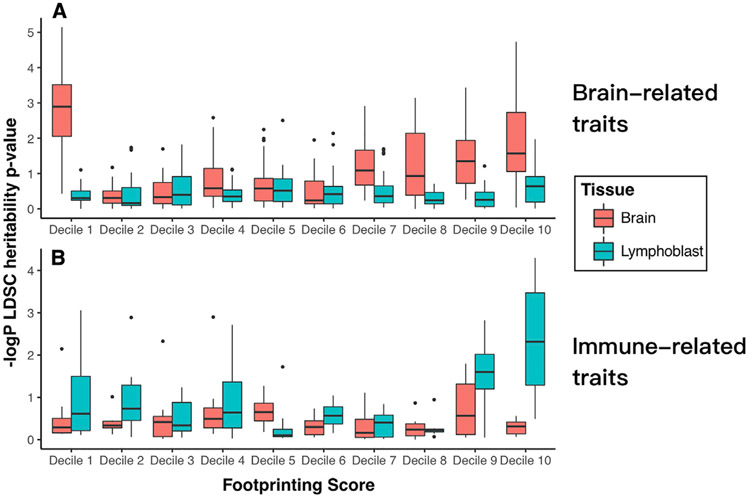
Figure 5. Partitioned Heritability of Tissue-Specific Footprints in Related GWAS by Footprint Confidence Score Decile.
(A) Partitioned heritability of brain footprints by decile in 27 summarized brain-related traits. Box plots indicate the median and interquartile range of −log10 (p values ) across the 27 traits.
(B) Heritability of lymphoblast footprint deciles in 8 summarized immune-related traits. Decile 1, lowest scores; decile 10, highest scores.

