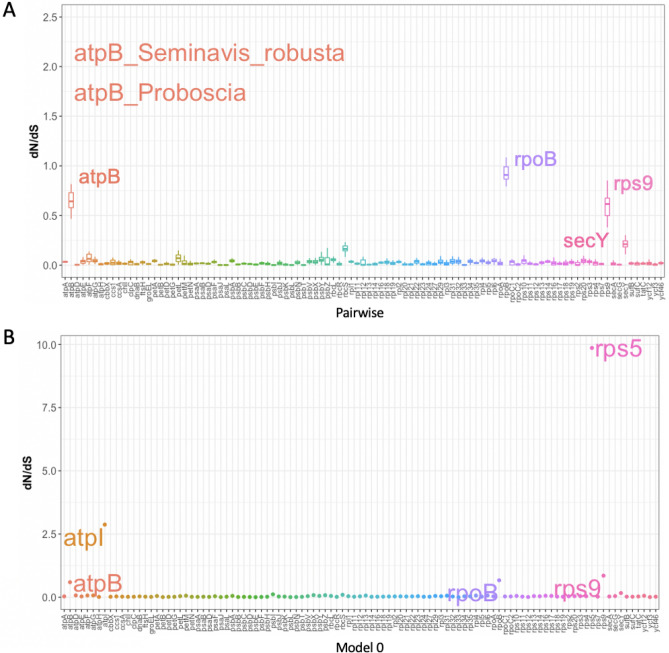
Figure 2.
Distribution of dN/dS values for individual genes across all diatoms. Two types of dN/dS methods were used; (A) one based on pairwise dN/dS rates against the outgroup, Triparma laevis, and (B) the other method was based on PAML model 0 that produced a single dN/dS value for each orthologous set. The orthologous set has their gene names arranged in alphabetical order from left to right. Genes with higher dN/dS rates are indicated on the plot. In the pairwise model, the ratio was visualised by boxplot with each boxplot consisting of 40 species dN/dS values. rps5 and atpI were not shown on the pairwise dN/dS boxplots because these are special cases subjected to CODEML model 8 vs 7 comparison in Table 1.

