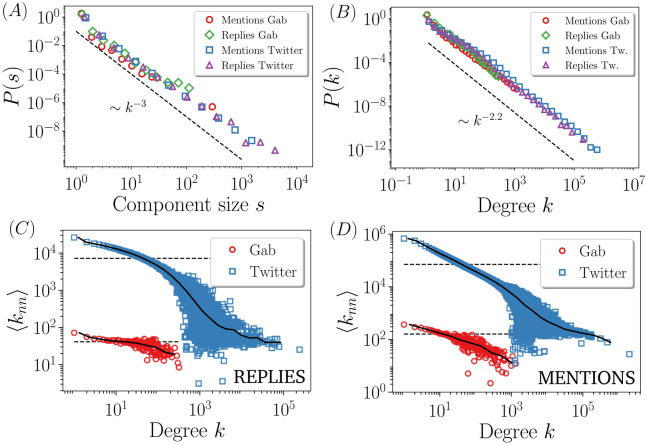
Figure 2.
(A) Component size distribution at the dismantling points of networks analyzed in Fig. 1B,C. The dashed line is not a fit, but is drawn to show that the distributions decay with an exponent smaller than 3, i.e., the second moment of the distribution diverges. (B) Degree distribution for the different networks and a curve scaling as to guide the eye. Degree correlations for the networks of replies (C) and for the networks of mentions (D). The solid curve is computed by averaging the data within k-bins, and the dashed horizontal line corresponds to , which is the value that would take if correlations are washed out.

