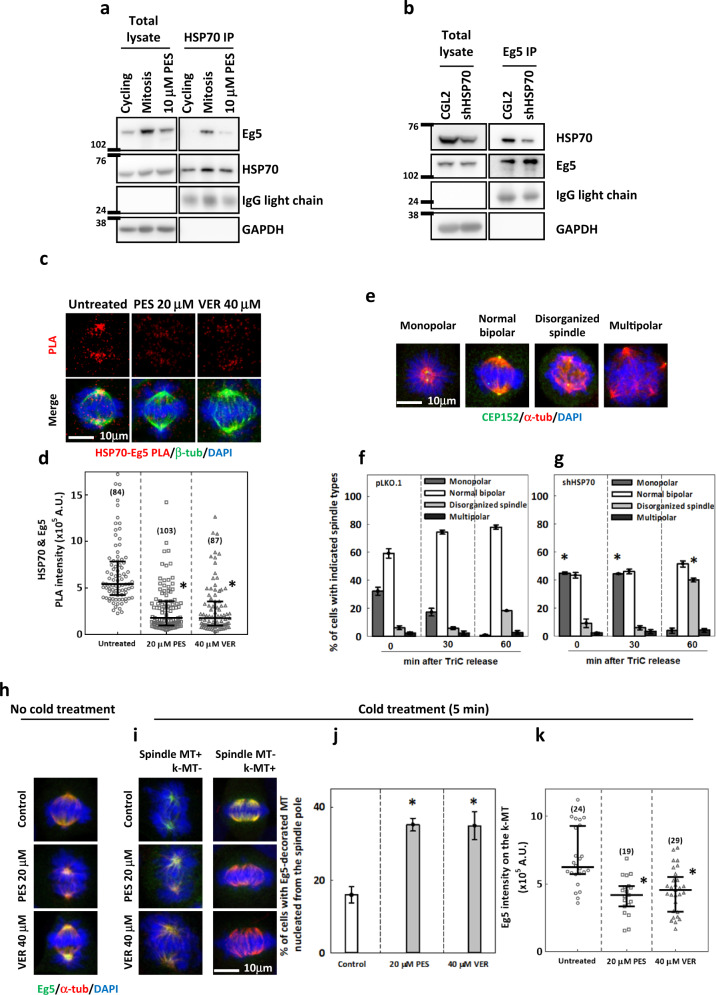
Fig. 2. HSP70 interacts with Eg5 within the spindle and is required for proper Eg5 mitotic function and localization.
a Eg5 was co-immunoprecipitated with HSP70 in the mitotic cells. The immunoprecipitation using HSP70 antibody were performed for extracts of CGL2 cells that were cycling, synchronized at mitosis or arrested at mitosis by 16 h PES treatment as described and Eg5 in the immunoprecipitates were detected by Western blotting. b Immunoprecipitation by Eg5 antibody was also performed using synchronized mitotic control or HSP70-depleted CGL2 cell extracts and HSP70 in the immunoprecipitates were detected by Western blotting. c A PLA was performed, and representative images are shown for HSP70-Eg5 PLA signal (red) with counterstaining of β-tubulin (β-tub, green) and DAPI (blue) in untreated and PES- or VER-treated CGL2 cells. d Relative intensity of HSP70-Eg5 PLA signal in the whole cell was measured as described. The scatter plot shows the interquartile distribution of HSP70-Eg5 PLA intensity, and the numbers in parentheses indicate the number of cells measured. *p < 0.05 compared to untreated by Mann–Whitney Rank Sum test. e Representative images of mitotic cells with the indicated types of spindle are shown after staining with CEP152 (green), α-tubulin (α-tub, red) and DAPI (blue). f–g Percentages of control (f, pLKO.1) and HSP70-depleted (g, shHSP70) mitotic cells with the indicated types of spindle. At least 600 mitotic cells were counted for each experiment. The mean ± SD from three independent experiments is shown. *p < 0.05 comparing shHSP70 to pLKO.1 by Student’s t test. h Representative images are shown for control and PES- or VER-treated mitotic cells fixed without cold treatment. i Representative images of the spindles in control and PES- or VER-treated cells that were fixed after 5 min cold treatment. Left, cells contained cold-resistant spindle MT with Eg5 colocalization (Spindle MT+; k-MT−). Right, cells with spindle MTs disassembled and k-MTs revealed (Spindle MT−; k-MT+). j The bar chart shows the percentages of mitotic cells with Eg5-decorated MTs nucleating from the spindle pole. At least 300 mitotic cells were counted for each experiment. The mean ± SD from three independent experiments is shown. *p < 0.05 compared to untreated by Student’s t test. k The scatter plot shows the interquartile distribution of relative Eg5 intensities on the k-MT, measured as described. The numbers in parentheses indicate the number of the cells measured. *p < 0.05 compared to untreated by Mann–Whitney Rank Sum test.

