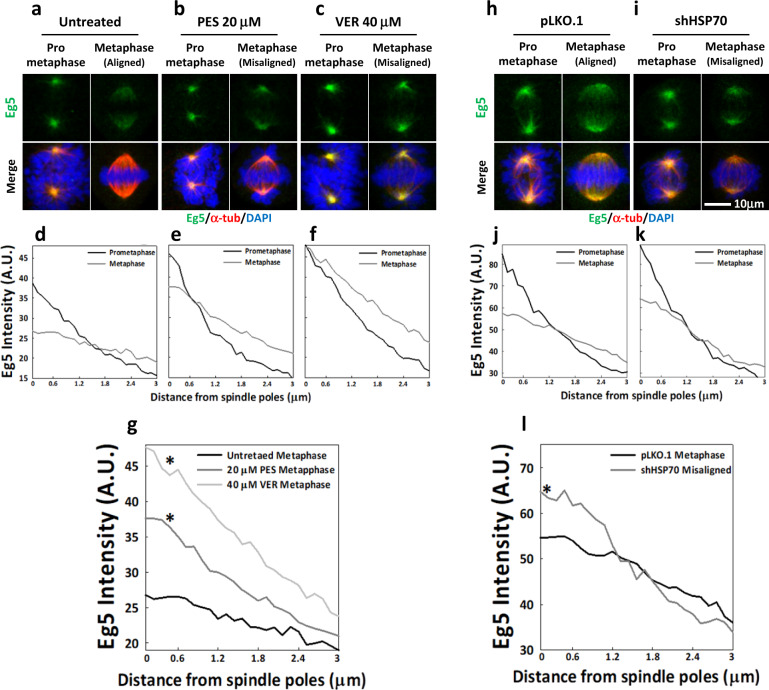
Fig. 3. HSP70 inactivation enhances pole accumulation of Eg5 and prevents its inward movement.
Representative images show the Eg5 (green) distribution within the spindle of untreated (a), PES-treated (b) and VER-treated (c) prometaphase and metaphase cells counterstained with α-tubulin (red) and DAPI (blue). Line-profile analysis of Eg5 intensity was performed as described. Eg5 intensity distributions were measured from at least 50 MT fibers in either prometaphase or metaphase cells. Data from cells imaged in two independent experiments were averaged to obtain the mean distribution curve and the 3 μm distance starting from spindle poles was plotted in (d) for untreated cells and in (e) and (f) for PES- and VER-treated cells, respectively. g Mean Eg5 distribution curves in untreated, PES- and VER-treated metaphase cells were plotted. Pairwise comparisons of the distribution curves were performed as described. *p < 0.05 compared to untreated. h–k Representative images show the Eg5 distribution within the spindle of the control (h. pLKO.1) and HSP70-depleted (i, shHSP70) prometaphase and metaphase cells. Eg5 intensity distributions were measured from at least 50 MT fibers in either prometaphase or metaphase cells. Data from cells imaged in two independent experiments were averaged to obtain the mean distribution curve and the 3 μm distance starting from spindle poles was plotted in (j) for control cells and in (k) for HSP70-depleted cells. l Mean Eg5 distribution curves in pLKO.1 control and HSP70-depleted metaphase cells were plotted. *p < 0.05 compared to pLKO.1.

