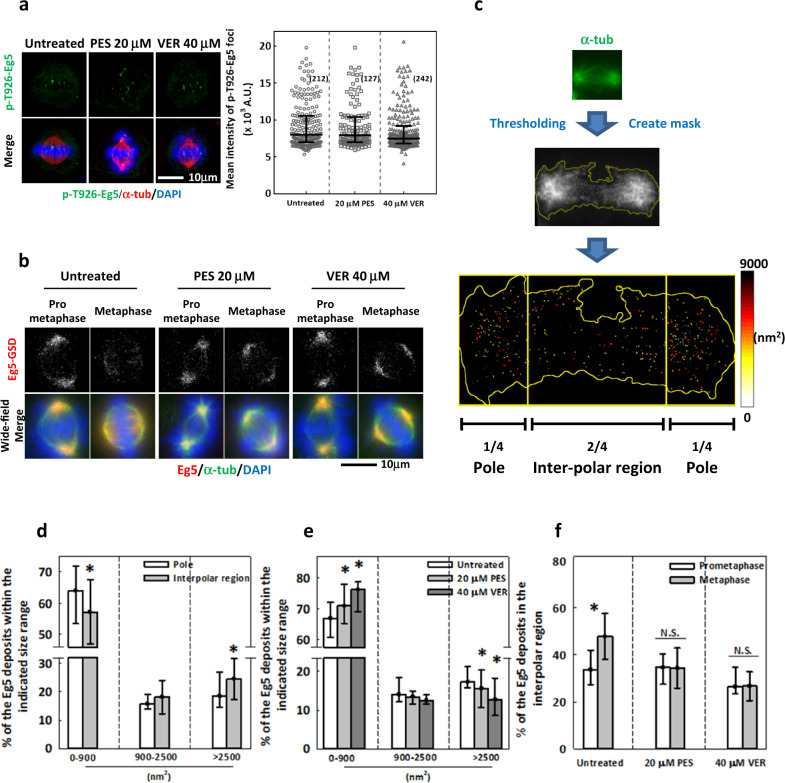
Fig. 4. HSP70 may modulate Eg5 oligomeric assembly to control its localization in the spindle.
a (left) Representative images show p-T926-Eg5 immunostaining (green) in untreated and PES- or VER-treated metaphase cells counterstained with α-tubulin (red) and DAPI (blue). (Right) Interquartile distribution of relative intensity of p-T926-Eg5 in the chromosome region was measured. Numbers in parentheses indicate the number of cells measured. b Representative GSD images show Eg5 immunostaining with corresponding wide-field images showing α-tubulin (green) and DAPI (blue) in untreated and PES- or VER-treated prometaphase and metaphase cells. c (Upper) The schematic illustration depicts the creation of a spindle mask by thresholding as described. (Lower) The Eg5 clusters were color-coded according to their sizes to reveal their distributions within spindle regions. d The percentages indicate Eg5 clusters within each indicated size range localizing to pole or inter-polar regions. The bar chart shows median ± 25th percentiles from at least 30 cells in four independent experiments. *p < 0.05 comparing inter-polar region to pole region by Student’s t test. e The percentages indicate Eg5 clusters within each indicated size range in the whole spindle of the untreated and PES- or VER-treated cells. The bar chart shows median ± 25th percentiles from at least 60 cells in four independent experiments. *p < 0.05 compared to untreated by Mann–Whitney Rank Sum test. f The percentages indicate the Eg5 clusters in the inter-polar regions of untreated and PES- or VER-treated prometaphase or metaphase cells. The bar chart shows median ± 25th percentiles from at least 20 cells in three independent experiments. *p < 0.05 comparing metaphase to prometaphase by Mann–Whitney Rank Sum test; N.S. no significance.

