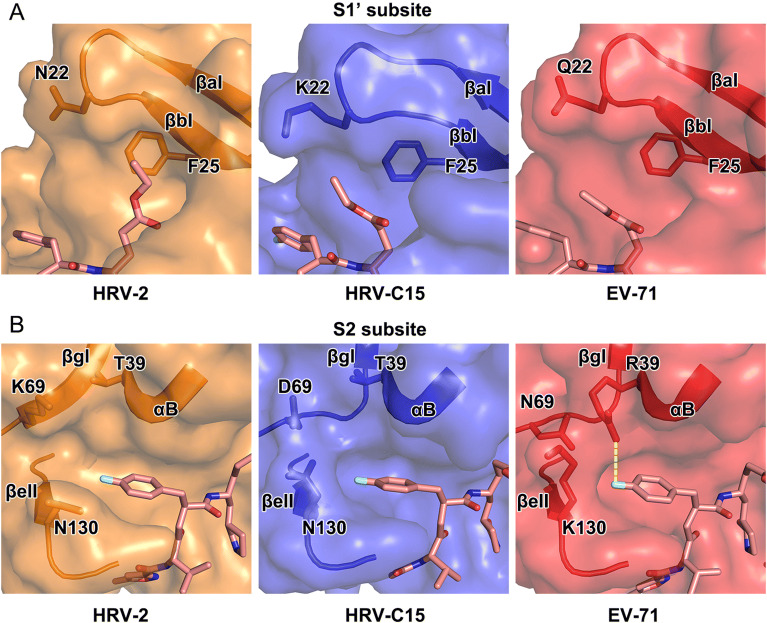
Fig. 4.
Structural comparison of the S1’ and S2 subsites of 3C proteases of HRV-2, HRV-C15 and EV71. In A and B, rupintrivir is shown as sticks and the 3C proteases are shown in surface representations with the key residues and secondary structural elements shown as sticks and cartoon, respectively. The polar interaction between R39 and P2 group of the inhibitor in the complex of EV71 is colored yellow in B.

