Fig. 5.
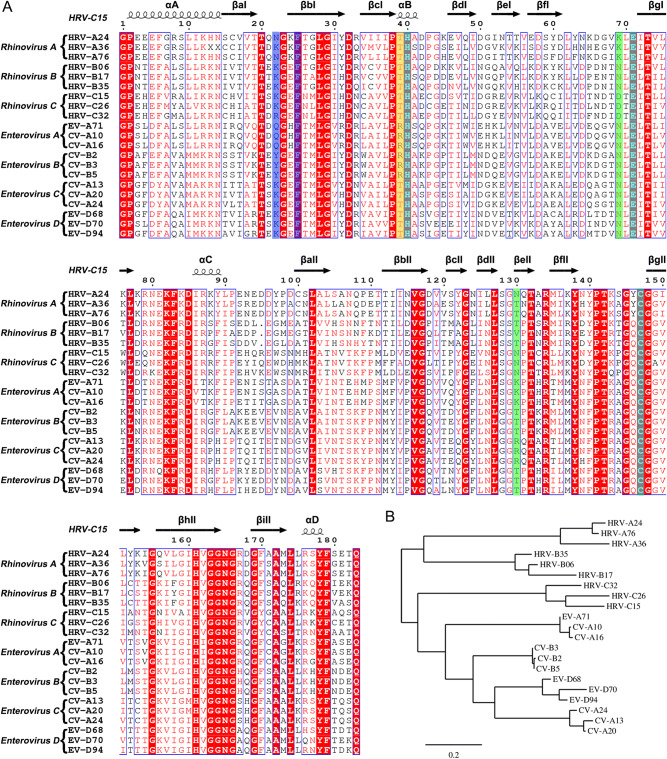
Sequence analysis of the 3C proteases from rhinovirus A–C and enterovirus A–D. A Multiple-sequence alignment of the 3C proteases using ESPript (Robert and Gouet 2014). The spiral lines indicate α-helices and the horizontal arrows represent β-strands. The catalytic triad is colored cyan. The residues which play key roles in decreasing the S1’ subsite volume are highlighted with a blue background. The residues that control the state of the S2 subsite are colored green. The residue which interacts with the P2 group of rupintrivir is highlighted with a yellow background. B Phylogenetic tree of the 3C proteases generated using the online tool—Phylogeny (Dereeper et al. 2008, 2010).

