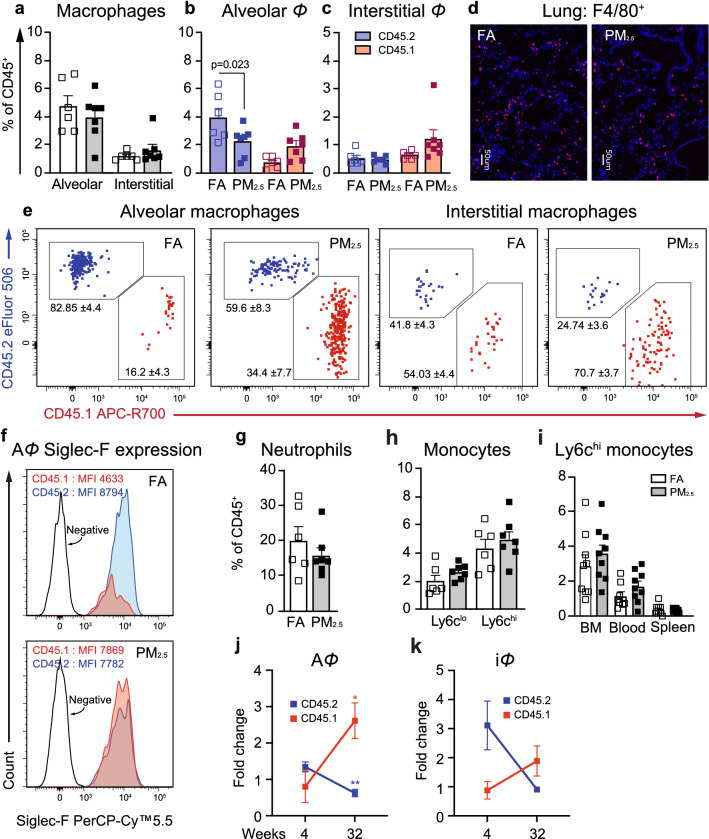
Figure 2.
Chronic PM2.5 exposure (32-weeks) impairs lung cellular immune homeostasis. (a) Lung macrophage (AΦ and iΦ) population. (b) AΦ of tissue-resident (CD45.2, blue) and bone marrow (CD45.1, red) origin. (c) iΦ of tissue-resident and bone marrow origin. (see also Supplementary Fig. 3). (d) Lung tissue stained for F4/80, showing total Φ in representative sections from 32-weeks FA and PM2.5 exposed mice, scale bar 50 μm. (e) Representative flow cytometry plots showing AΦ and iΦ of tissue-resident (blue) and BM-origin (red) showing frequencies of the respective population. (f) Siglec F expression on TR-AΦ and BM-AΦ, representative plots from FA (left), and PM2.5 (right) exposed mice. (g) Neutrophil population in the lungs. h. Monocytes subsets (Ly6clo and Ly6chi) in the lungs. (i) Ly6chi monocyte population from bone marrow, blood, and spleens. (j, k) Fold change in tissue-resident and BM-derived, (j) AΦ and (i) iΦ at 32-weeks over 4-weeks of PM2.5 exposure. Data are represented as % of total CD45+ cells, mean ± SEM, from two independent experiments with 4–6 mice in each experiment (a–c, g–i) and as fold change over control FA exposed mice (j, k). Data were analyzed with GraphPad prism v8.3 using Student’s ‘t’ test or one-way ANOVA with Bonferroni’s posthoc test for multiple comparisons, statistically significant p values (< 0.05) are mentioned for respective comparison.

