Figure 3.
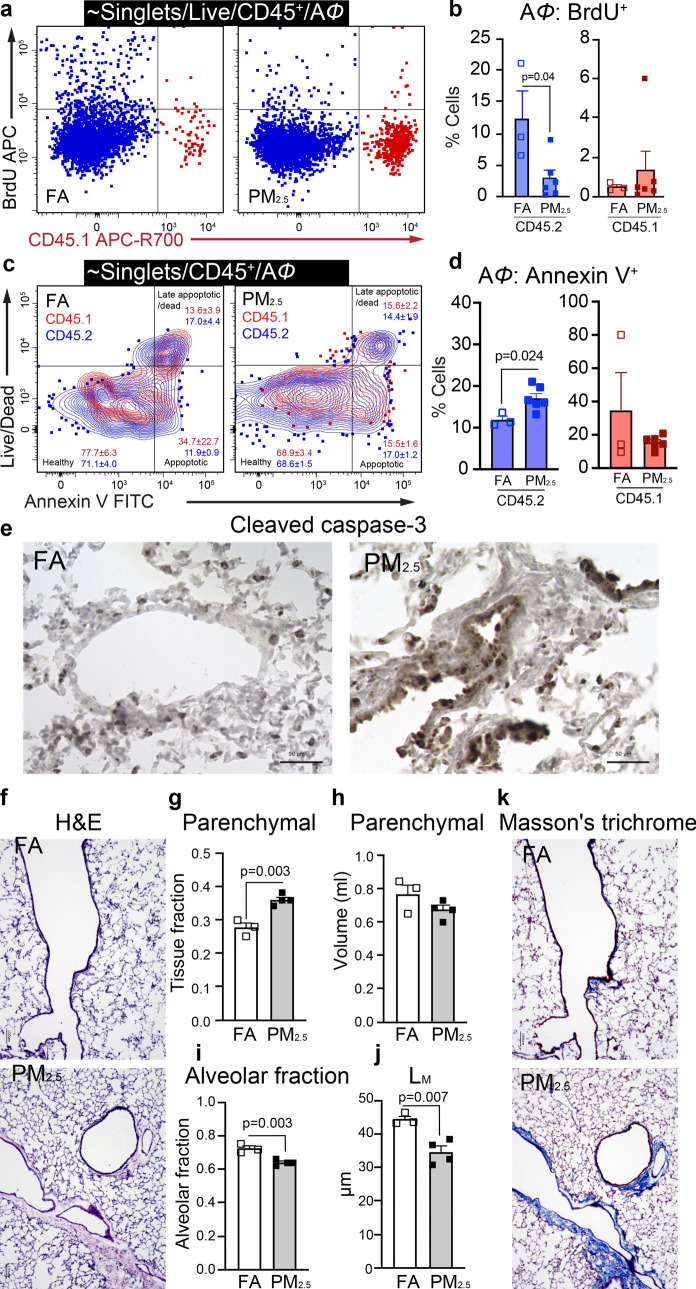
Chronic PM2.5 exposure impairs the proliferation potential and increased apoptosis in TR-AΦ. (a) Representative gating plots for BrdU+ in AΦ from 32-weeks of PM2.5 and FA exposed mice. (b) BrdU+ (proliferating) TR-AΦ and BM-AΦ. (c) Representative gating plots for Annexin V+ AΦ from 32-weeks of PM2.5 and FA exposed mice, showing frequencies of the respective population. (d) Annexin V+ (apoptotic) TR-AΦ and BM-AΦ. (e) Representative images of lung sections stained for Cleaved caspase-3 (apoptosis), scale bar 50 μm. (f) Representative images of lung sections stained for H&E (scale bar 100 μm) for lung morphometry quantitative analysis, (g–j) (see also Supplementary Fig. 5c). (g) Parenchymal tissue fraction, (h) Parenchymal volume. (i) The alveolar fraction of lung parenchyma. (j) Mean linear intercept of parenchymal airspaces (LM). (k) Representative images of lung sections stained for Masson’s trichrome (Fibrosis), scale bar 100 μm. Separate mice were used for histological and morphometric analysis, and BrdU and Annexin V staining. Data were analyzed with GraphPad prism v8.3 using Student’s ‘t’ test or one-way ANOVA with Bonferroni’s posthoc test for multiple comparisons, statistically significant p values (< 0.05) are mentioned for respective comparison.

