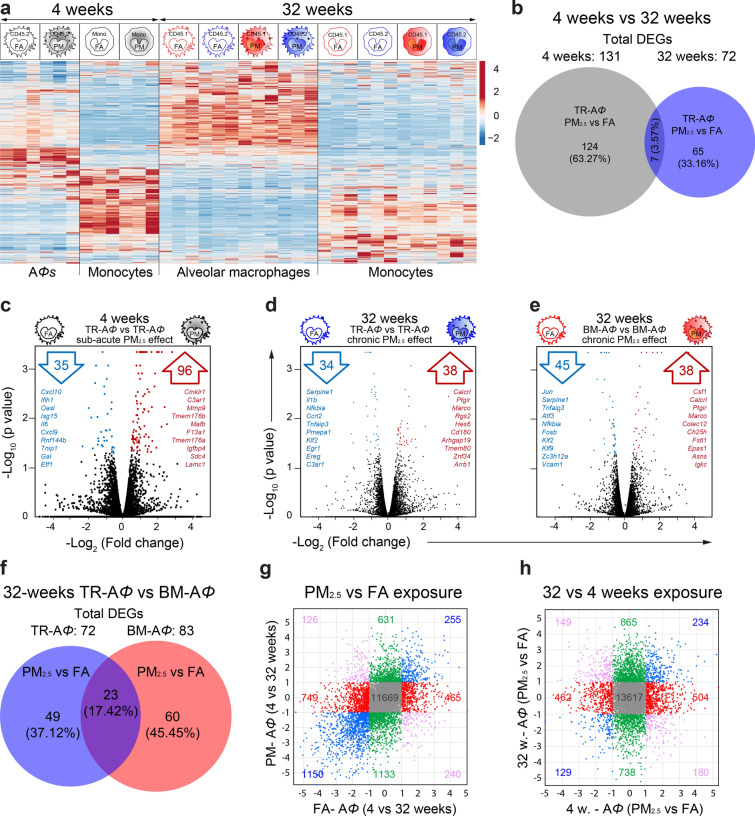
Figure 4.
Transcriptomic landscape of AΦ with PM2.5 exposure. (a) Heat map of all significantly differentially expressed genes in AΦ and lung monocytes, of CD45.2 and CD45.1 origin from 4- and 32-weeks of FA and PM2.5 exposed mice. (b) Quantitative Venn diagram showing unique and common DEGs at 4- and 32-weeks of exposure. (c–e) Volcano plots of different pairwise comparisons showing, up- (red) and downregulated (blue) genes. In each volcano plot, top listed genes are ten Hallmark genes and/or immunological signature genes. (f) Quantitative Venn diagram showing unique and common DEGs in TR-AΦ and BM-AΦ at 32-weeks exposure. (g, h) Common and unique significant DEGs in four-way plots showing the effect of (d) PM2.5 vs FA exposure, and (e) exposure time (4- and 32-weeks). Fold change (Log2) values are plotted for respective comparisons mentions on the x- and y-axes. Data were generated using three mice from each group.

