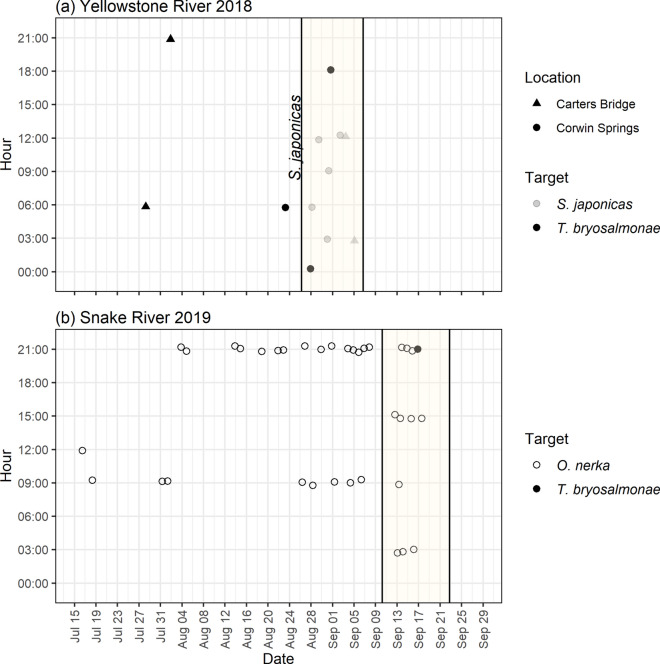
Figure 4.
Temporal distribution of positive detections from ESP samples collected from two locations in the Yellowstone River in 2018 (a) and one location in the Snake River in 2019 (b). S. japonicas slurry introductions to Yellowstone River locations are indicated by the vertical line on Aug 27. S. japonicas and T. bryosalmonae DNA were detected at Yellowstone River locations and O. nerka and T. bryosalmonae DNA were detect at the Snake River. Shaded areas indicate time period when samples were collected every 3 h (a) or 4 h (b) rather than every 12 h.

