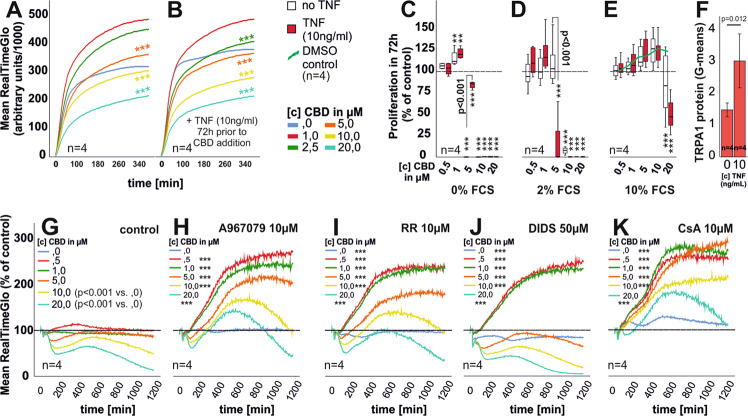
Fig. 1. Assessment of cell viability, TRPA1 expression, and RASF proliferation.
a, b Mean cell viability of unstimulated (a) or TNF pre-stimulated (b) RASF after CBD challenge monitored in real-time over the course of 375 min. c–e Mean proliferation of RASF with (red bars) and without (white bars) TNF pre-stimulation in response to CBD in medium containing 0% FCS (c), 2% FCS (d), and 10% FCS. The dotted line represents the unstimulated control, which was set to 100%. f Flow cytometric detection of TRPA1 protein in RASF with or without TNF stimulation for 72 h. g–k Mean cell viability of TNF pre-stimulated RASF after CBD challenge and concomitant addition of inhibitors over the course of 20 h. n is the number of replicates and patient samples investigated. ANOVA with Dunnett’s T3 post-hoc test was used for comparisons in a, b, g–k. ANOVA with Bonferroni post-hoc test was used for comparisons in c–e. Two-tailed t-test was used for comparisons in f. *p < 0.05; **p < 0.01, ***p < 0.001 vs control. The error bars in c–f represent the standard error of mean (sem).

