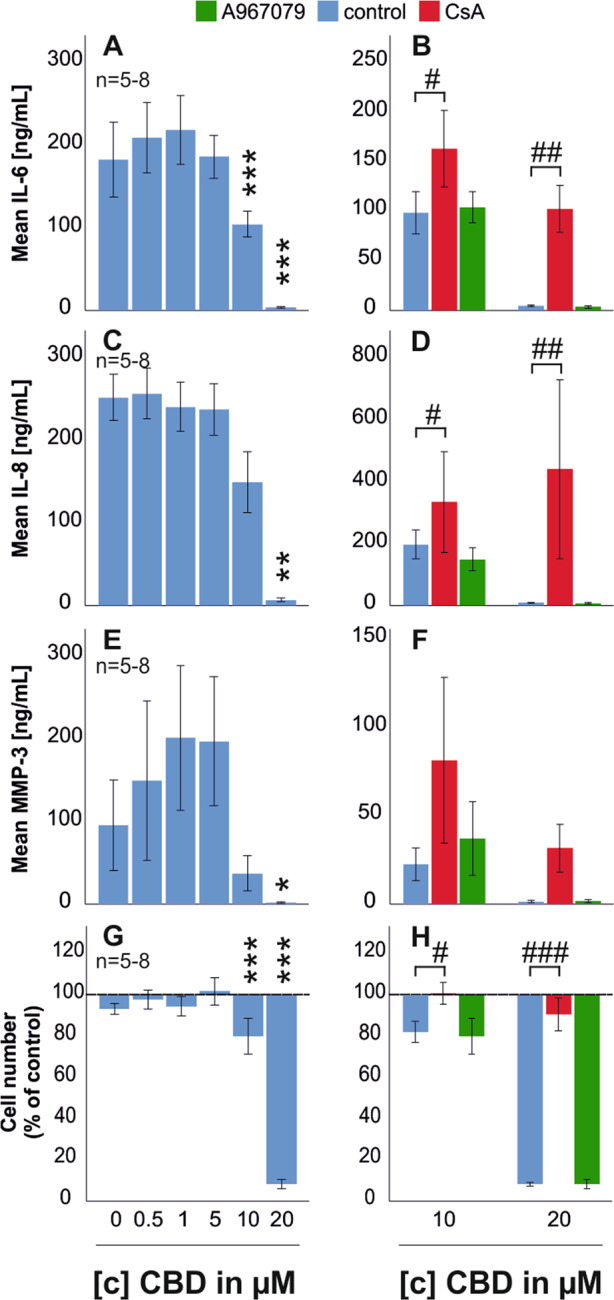
Fig. 5. IL-6, IL-8, MMP-3 production, and cell number after 72 h incubation with CBD.

RASF were incubated for 72 h with TNF. After wash-off, RASF were challenged with antagonists for 30 min followed by CBD addition for 72 h. ANOVA was used for all comparisons vs control w/o CBD. a, c, e, g IL-6, IL-8, MMP-3 production, and cell number after 72 h challenge with CBD. b, d, f, h IL-6, IL-8, MMP-3 production, and cell number after 72 h challenge with CBD (10 µM and 20 µM) with concomitant addition of the TRPA1 antagonist A967079 and the mPTP inhibitor CsA. Significant differences between CBD in different concentrations are depicted as *p < 0.05, **p < 0.01, and ***p < 0.001, and CBD versus CBD/antagonist treatment are depicted as #p < 0.05, ##p < 0.01, and ###p < 0.001. ANOVA with Bonferroni post-hoc test was used for all comparisons. The dotted line in g, h represents the control value which was set to 100%. n is the number of replicates out of four different patient samples. The error bars represent the standard error of mean.
