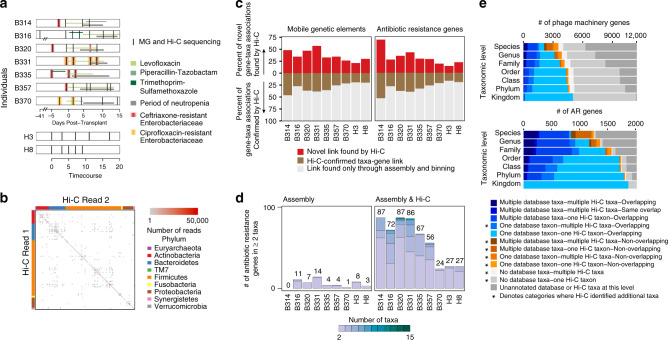
Fig. 1. Hi-C can be used to track mobile genetic elements.
a Neutropenic hematopoetic stem cell transplant (B) recipients’ and healthy (H) individuals’ timecourses included in the study are depicted, with periods of neutropenia (gray) and antibiotic use (green). Black lines indicate timepoints for which metagenomic and Hi-C libraries were constructed. Red lines indicate gastrointestinal colonization with MDR enteric pathogens. b Each Hi-C read pair that maps to two non-mobile contigs is plotted according to the taxonomic assignment of each read. Color depicts the number of reads linking contigs according to taxonomy. c The percent of the total taxa-mobile gene (left) and taxa–AR gene (right) associations observed from metagenomic assembly that are supported by two or more Hi-C links (brown) is plotted, along with the percent additional interactions gained by using Hi-C (red). d Stacked bar plots showing the number of species-level taxa to which each AR gene (clustered at 99% identity) is assigned within each patient, and across patients. Only those genes assigned to two or more taxa are shown. We either used metagenomic assemblies alone to assign taxonomies (left) or combined with Hi-C libraries considering those taxa-gene assignments with evidence from at least two Hi-C reads. The numbers above each stacked barplot represent the total number of AR genes with two or more taxonomic associations. e Horizontal stacked bar plots show the percentage of unique phage genes (defined as 95% similar) (above) or AR genes (below) in the metagenomic assemblies and the origins of their taxonomic associations, identified either by BLAST to NCBI’s NT (for phage) or PATRIC’s reference database (for AR genes) or through Hi-C linkages.

