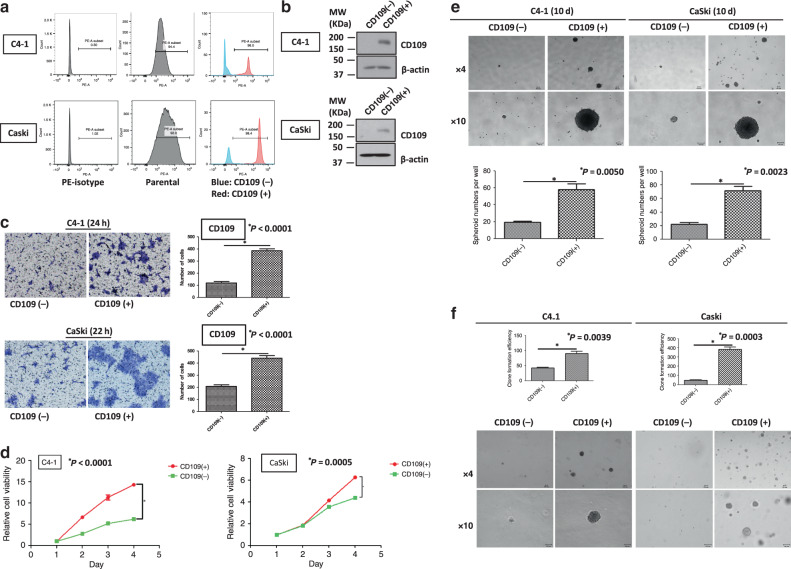
Fig. 2. Sorted CD109(+) cells displayed enhanced carcinogenic and aggressive abilities.
The purity of CD109- expressed cells in sorted CD109(−) and CD109( + ) subpopulations was confirmed by flow-cytometric (a) and western blot analysis (b). c A representative image (left) and quantification bar graph (right) of migrated sorted CD109(−) and CD109( + ) subpopulations in C4-1 and CaSki cells (crystal violet). d Proliferation analyses of sorted CD109(−) and CD109( + ) subpopulations in C4-1 and CaSki cells. *PC4-1 < 0.0001, PCaSki = 0.0005, using the Student’s t test. e Representative images of spheroids formed by sorted CD109(−) and CD109( + ) cells (above, magnification, ×4, ×10). Bar graph (below) represents the mean number of spheroids from each well under the microscope, and error bars represent SD, *PC4-1 = 0.005, PCaSki = 0.0023. f CD109- enhanced anchorage-independent cell growth ability was confirmed by soft-agar colony-formation assay. The sorted CD109( + ) cells formed larger and more clones than CD109(−) cells. *PC4-1 = 0.0039, PCaSki = 0.0003, using the Student’s t test.

