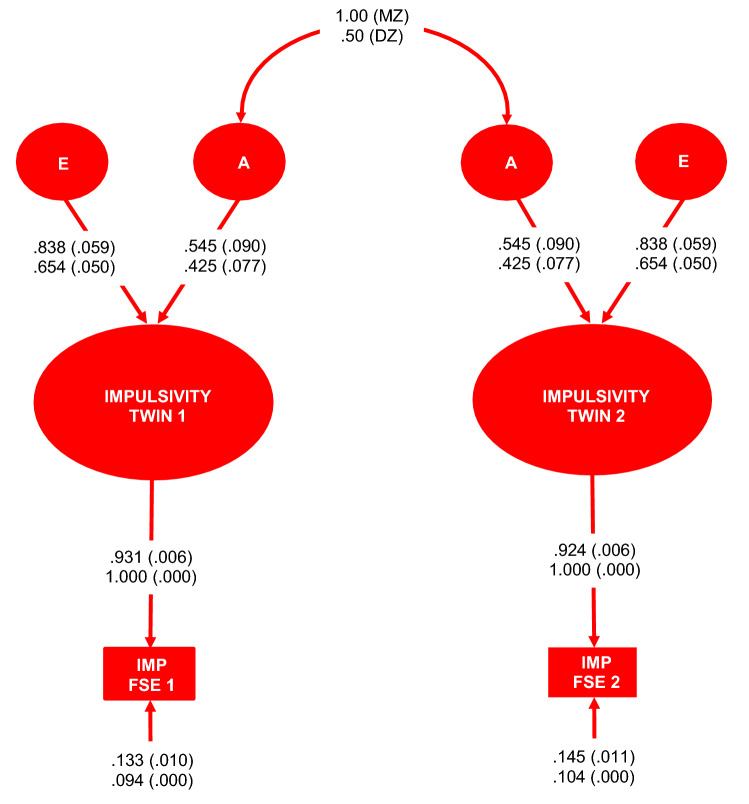
Figure 3.
Additive genetic and unique environment plus error (AE) [χ2(6) = 5.177, p = 0.521; BIC = 873.819; Hi (Pr | D) = 0.604]; variance components model for the Impulsivity phenotype. MZ monozygotic twins, DZ dizygotic twins, E unique environment plus measurement error variance component, A additive genetic variance component, Age age in years, IMP FSE 1 twin 1 subsample impulsivity factor score estimates, IMP FSE 2 twin 2 subsample impulsivity factor score estimates. Fully standardised parameter estimates with standard errors in brackets appear above. Unstandardised parameter estimates with standard errors in brackets appear below. Figure created in Microsoft Excel 2016, Office desktop (16.0.12624.20424) 64-bit.

