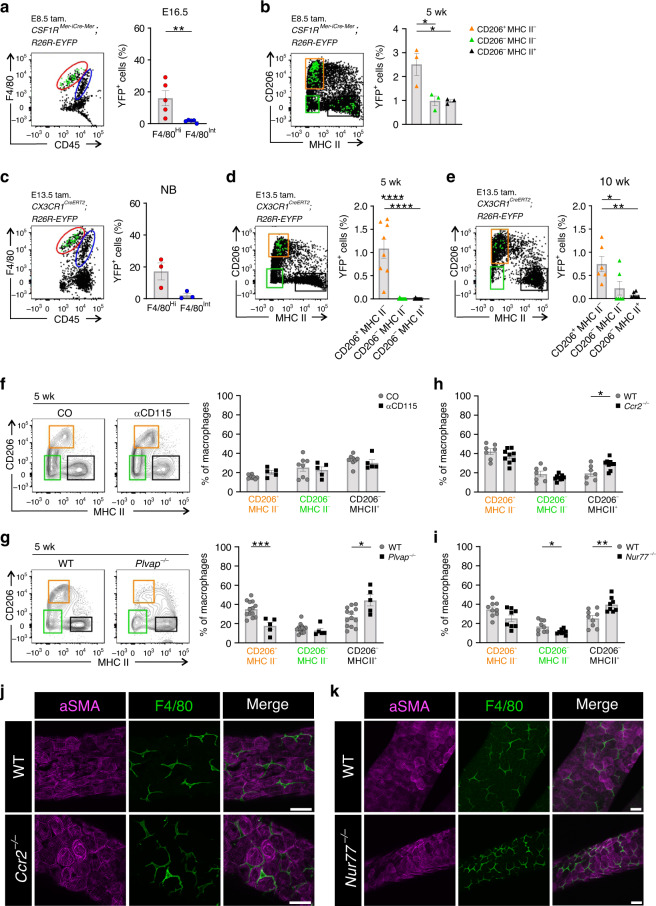
Fig. 4. Fetal-derived macrophages dominate in the postnatal testis.
a–e Representative FACS plots and quantification of yolk-sac-derived macrophages in cell lineage mapping studies. The plots show back-gating of the YFP+ cells (green) in 5-week-old mice on the different testicular macrophage populations. a, b CSF1RMer−iCre−Mer;R26R-EYFP mice induced with tamoxifen at E8.5 and analyzed at a E16.5 and b 5 week. c–e CX3CR1CreERT2;R26R-EYFP reporter mice induced with tamoxifen at E13.5 and analyzed at c birth (NB), d 5-week, and e 10-week. The quantifications show the frequency of YFP+ cells in CD206+MHC II− (orange gate), CD206−MHC II− (green gate), and CD206−MHC II+ (black gate) testicular macrophage populations. f Analysis of the testicular macrophage frequencies in 5-week-old WT mice treated with a depleting CD115 or control antibody at E6.5. g–i Flow cytometric analyses and quantifications of macrophage populations in the testis of 5-week-old (g) Plvap−/−,(h) Ccr2−/− and (i) Nur77−/− mice. j, k Seminiferous tubule whole-mount stainings of WT, Ccr2−/−, and Nur77−/− mice with antibodies against αSMA (expressed in peritubular myoid cells), and F4/80 (a pan-macrophage marker). Shown are representative images from three mice. Scale bar (j, k) 50 µm. In the quantifications, each dot represents one mouse (n = 3 (b, c), 5 (a: YFP, f: CD115, g: Plvap−/−), 6 (e), 7 (h: WT), 8 (d: YFP, f: CO, i: Nur77−/−), 9 (h: Ccr2−/−, i: WT), or 13 (g: WT) mice). Data are presented as mean ± SEM (*p < 0.05, **p < 0.01, ***p < 0.001, ****p < 0.0001, one-way ANOVA with Bonferroni post-hoc test (b, d, e) and Two-tailed Mann–Whitney U test (a, c, g–i)). All data are from 2–5 independent experiments. Source data are provided as a Source Data file.

