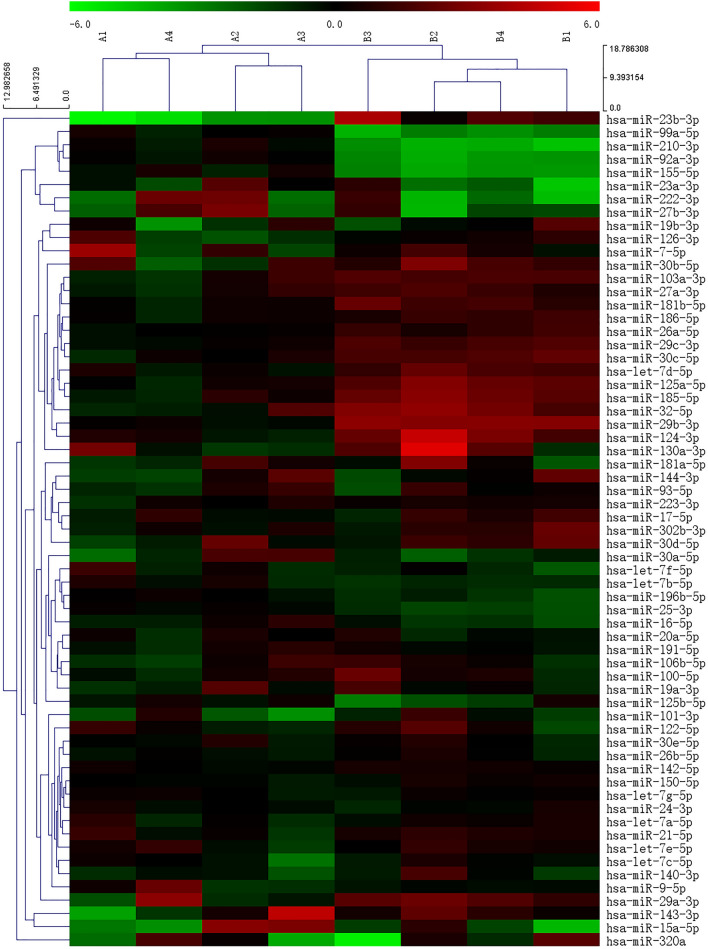
Figure 4.
Heatmap of exosomal miRNAs differentially expressed between the high-BAT and low-BAT groups. Hierarchical clustering analysis of the 84 commonly expressed miRNAs by the Euclidean distance method. Each row represents one miRNA, and each column represents one tissue sample. The relative miRNA expression level is depicted according to the color scale. Red indicates elevated expression, and green indicates reduced expression. The numbers 2, 0, and − 2 indicate fold changes along the corresponding spectrum. High-BAT group (B1–4). Paired Low-BAT group (A1–4).

