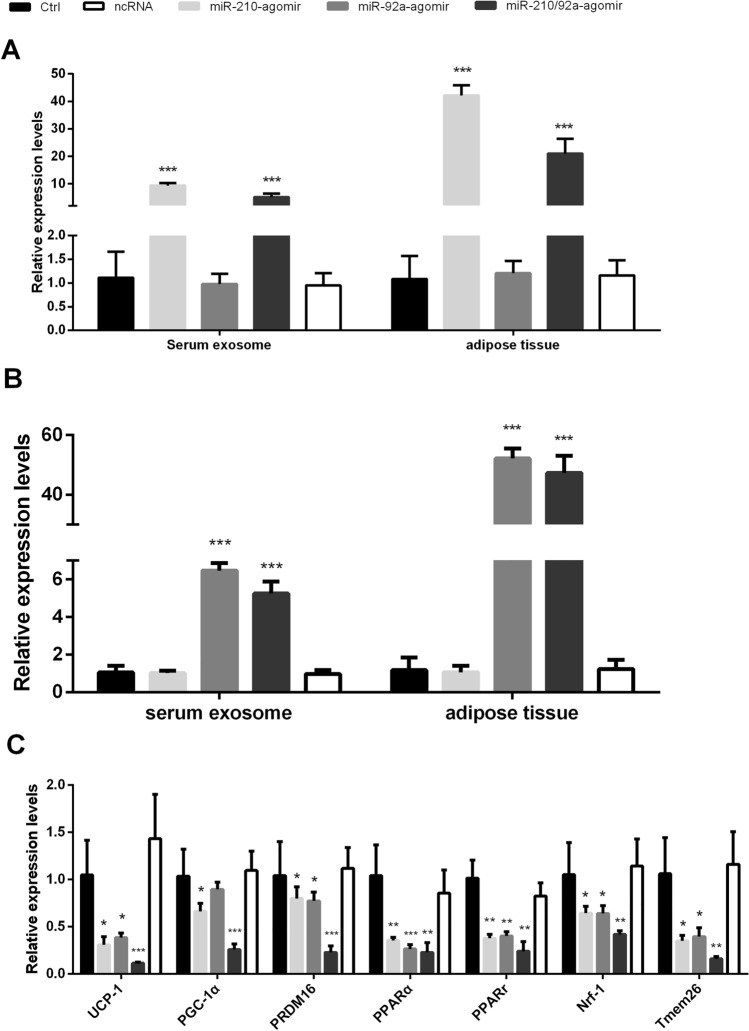
Figure 7.
(A) The relative expression levels of miR-210 in serum and visceral WAT from the agomir/ncRNA/Ctrl groups of 4,300 m-raised mice. (B) The relative expression levels of miR-92a in serum and visceral WAT from the agomir/ncRNA/Ctrl groups of 4,300 m-raised mice. The results were obtained by qPCR analysis. The relative quantification was obtained by the ∆∆CT method with normalization to U6. n = 6 per group. (C) Brown adipose-selective genes’ relative expression levels in BAT from the agomir/ncRNA/Ctrl groups of 4,300 m-raised mice. The relative quantification was obtained by the ∆∆CT method compared with 18S rRNA. n = 6 per group (*p ≤ 0.05 indicates statistical significance. **p ≤ 0.01, ***p ≤ 0.001, Student’s t test. The Ctrl-(4,300 m) group was used as the control.

