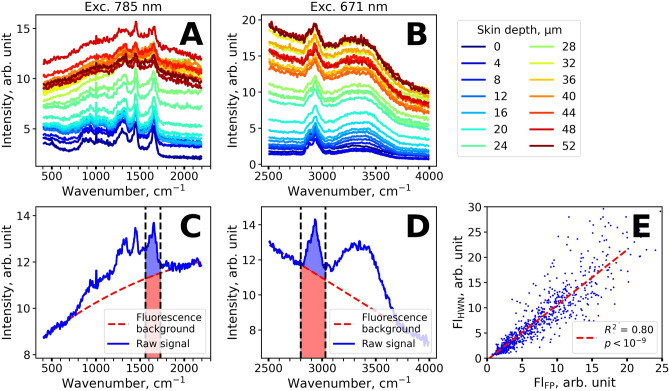
Figure 1.
Characteristic depth-resolved Raman spectra of skin in vivo and examples of fluorescence background subtraction. (A,B) Depth-resolved Raman spectra of the human skin in the 400–2,200 cm−1 (A) and 2,500–4,000 cm−1 (B) ranges. Spectra are color-coded according to the measurement depth, ranging from 0 to 60 µm with 2 µm increments. (C,D). The examples of fluorescence background subtraction (red dashed line) for representative Raman spectra (blue line) in the 400–2,200 cm−1 (C) and 2,500–4,000 cm−1 (D) ranges. Red and blue areas filled in (C,D) represent fluorescence and Raman signal intensities used to estimate normalized fluorescence intensity (Fl-FP and Fl-HWN). (E) Correlation between the normalized fluorescence Fl-FP and Fl-HWN excited at 785 and 671 nm, correspondingly.

