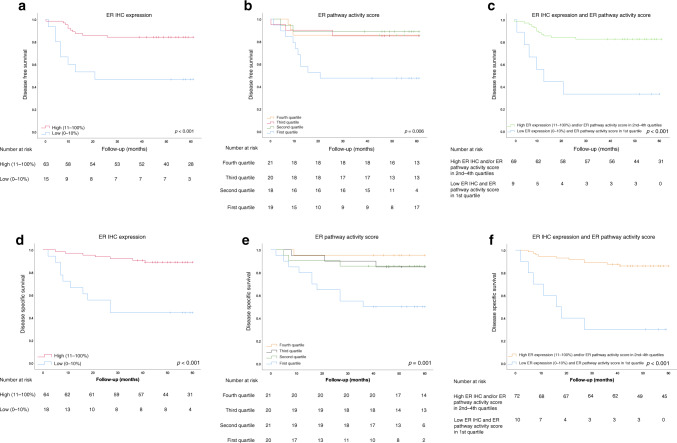
Fig. 5. Disease-free and disease-specific survival according to ER IHC expression and ER pathway activity in the Nijmegen clinical cohort.
a Kaplan–Meier curve for DFS according to ER IHC expression; cut-off, 10%. b Kaplan–Meier curve for DFS according to ER pathway activity, divided into quartiles. c Kaplan–Meier curve for DFS for patients with combined low ER IHC expression (0–10%) and ER pathway activity in the first quartile, relative to patients with high ER IHC expression (11–100%) or ER pathway activity in the second-to- fourth quartiles. d Kaplan–Meier curve for DSS according to the ER IHC expression; cut-off, 10%. (e) Kaplan–Meier curve for DSS according to ER pathway activity, divided into quartiles. f Kaplan–Meier curve for DSS for patients with combined low ER IHC expression (0–10%) and ER pathway activity in the first quartile, relative to patients with high ER IHC expression (11–100%), and/or ER pathway activity in the second-to-fourth quartiles. Five patients with residual disease were excluded from panels a–c.

