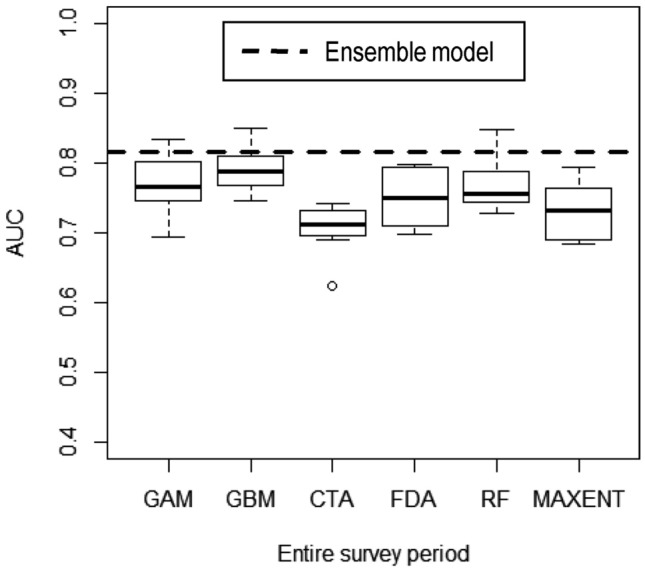
Figure 3.

Performance of species distribution models of Australian humpback dolphins in northern Ningaloo Marine Park, Western Australia, built with datasets for the entire survey period (May 2013—October 2015). Box-plot displaying the Area Under Curve (AUC) of the receiver operating characteristics evaluation scores for all models, grouped by modelling algorithm (GAM generalised additive model, GBM generalised boosted model, CTA classification tree analysis, FDA flexible discriminant analysis, RF random forest, MAXENT maximum entropy). Components of box-plot represent minimum (the bottom of the whisker), lower quartile (bottom edge of box), median (bold line drawn inside the box), upper quartile (upper edge of box), maximum (top of the whisker) and outlier AUC values (empty circles) for each modelling method. Dashed line indicates the predictive performance (AUC) of the ensemble model (AUC = 0.82). Values of AUC ≥ 0.7 indicated the ensemble model performed reasonably well.
