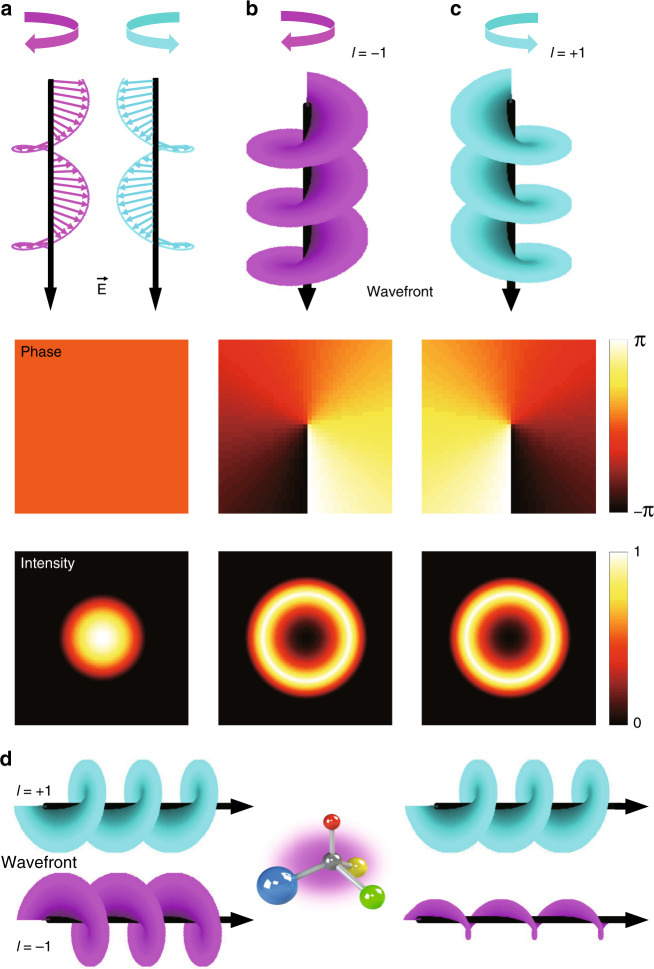
Fig. 9. Illustrations of chiral light.
a Circularly polarized light with l=0. Top row: spatial distribution of electric fields, middle row: cross-section of the phase distribution, bottom row: cross-section of the intensity distribution. Light carrying b l=−1 and c l=+1 OAM. Top row: wavefront, middle row: cross-section of the phase distribution, and bottom row: cross-section of the intensity distribution. d Illustrations of helical dichroism. Light carrying l=+1 (blue) OAM interacts weakly with the chiral object, while light with l=−1 (pink) interacts strongly and is absorbed

