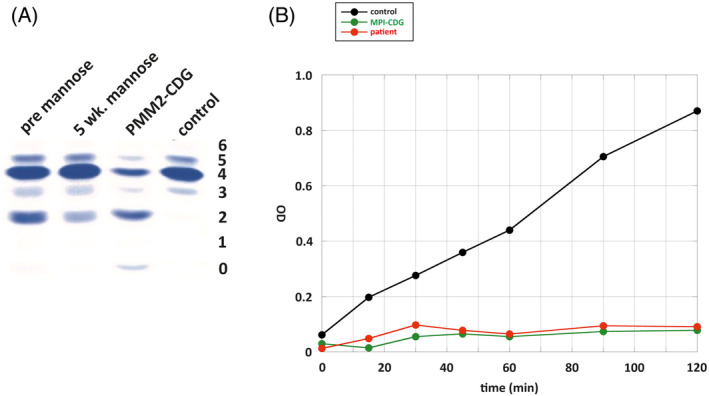
FIGURE 2.

Glycosylation analysis and phosphomannose isomerase activity assay. A, Transferrin isoelectric focusing analysis of the patient (pre mannose) reveals CDG type I glycosylation pattern. PMM2‐CDG patient and healthy (control) sera were used as negative and positive controls, respectively. After 5 weeks of mannose treatment, the patient showed vanishing of asialo‐ and decrease of disialo‐transferrin. B, MPI activity assay in leukocytes of patient (red) reveals absence of MPI activity comparable to a confirmed MPI‐CDG patient (green), in contrast to normal activity of a healthy control (black)
