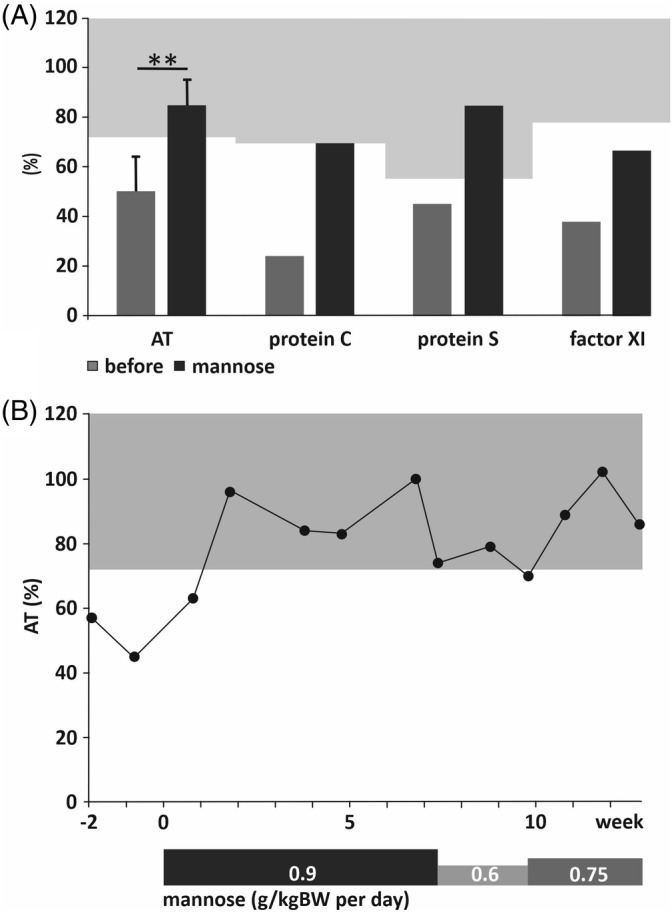
FIGURE 3.

Activities of coagulation system glycoproteins before and after initiation of mannose therapy. A, Activities of AT, protein C, protein S and factor XI before (dark‐grey bars) and during (black bars) mannose therapy. Error bars indicate SD for AT measurements (n = 22 before and n = 18 during therapy). Number of measurements of protein C, protein S and factor XI were 1‐2, respectively, thus no error bars or statistics were calculated. Light grey areas indicate normal ranges of the respective glycoprotein activities. Level of significance was determined by unpaired two‐sided Student's t test; **P < .001. B, Time course of AT activity 2 weeks before start and during mannose therapy, dosing as indicated below. Light grey area indicates normal range of AT activity
