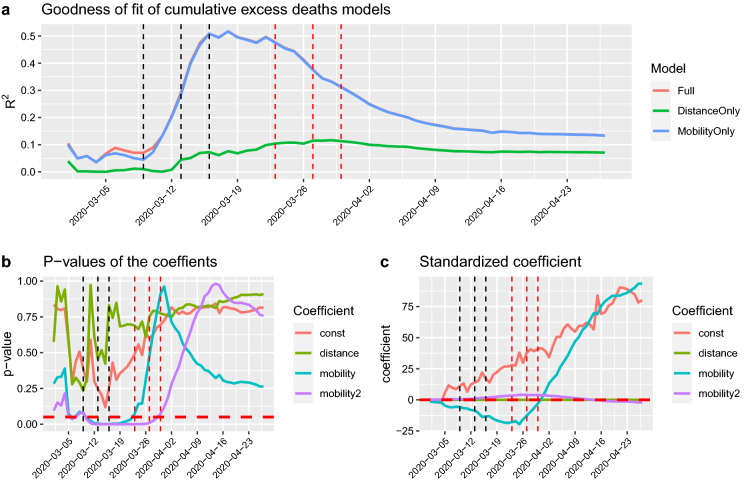
Fig. 3.
a The is explained mostly by the mobility indicator and reaches its maximum on 16 March 2020. When the lockdown measures are in force, then the spread is explained by the distance from the Haut-Rhin department, where the spreading of the virus has believed to have started, but also other factors captured by the constant effect. b The p values of the coefficients are presented. The horizontal line represents the 0.05 significance level and c the standardised values of the same coefficients to appreciate the relative impact of each on explaining the outcome variable. (Color figure online)

