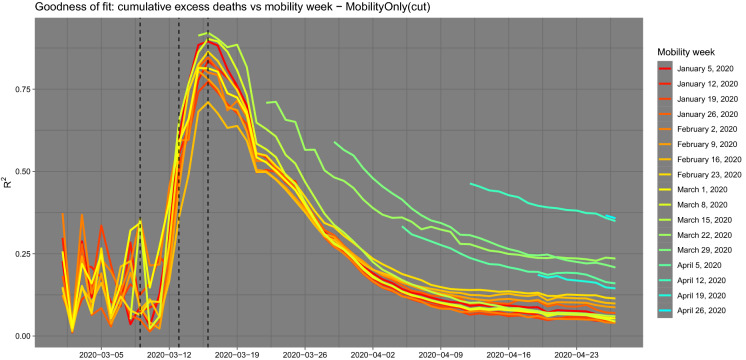
Fig. 5.
evolution for each mobility week using the model based on mobility alone on the selected data set of positive excess deaths and mobility index. The peak of correlation is on 16 March 2020 and the mobility week is the one between 15 and 21 March 2020. A similar pattern is shown for all weeks, explaining that mobility has no effect before the COVID-19 outbreaks and has a fast decay after the lockdown measures are in place (left and right tails of the figure). On the contrary, during the initial emergency phase mobility is a key element of the spread of the virus and therefore on fatalities

