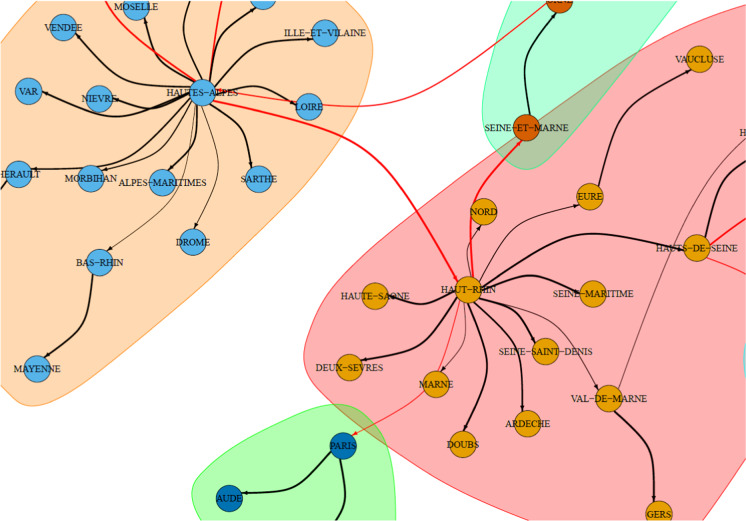
Fig. 7.
A zoomed section of the graph of lead–lag relationships between internal mobility (origin) and cumulative excess deaths (destination). Full network is shown in Fig. 8. The graph is zoomed on Haut-Rhin. This cluster shows that the internal mobility of Haut-Rhin correlates maximally with the cumulative excess deaths of several other departments at different lags. The width of the edges is inversely proportional to the estimated lag: the smaller the lag, the thicker the edge. Red edges connect two different clusters. No causality effect should be read from this graph. (Color figure online)

