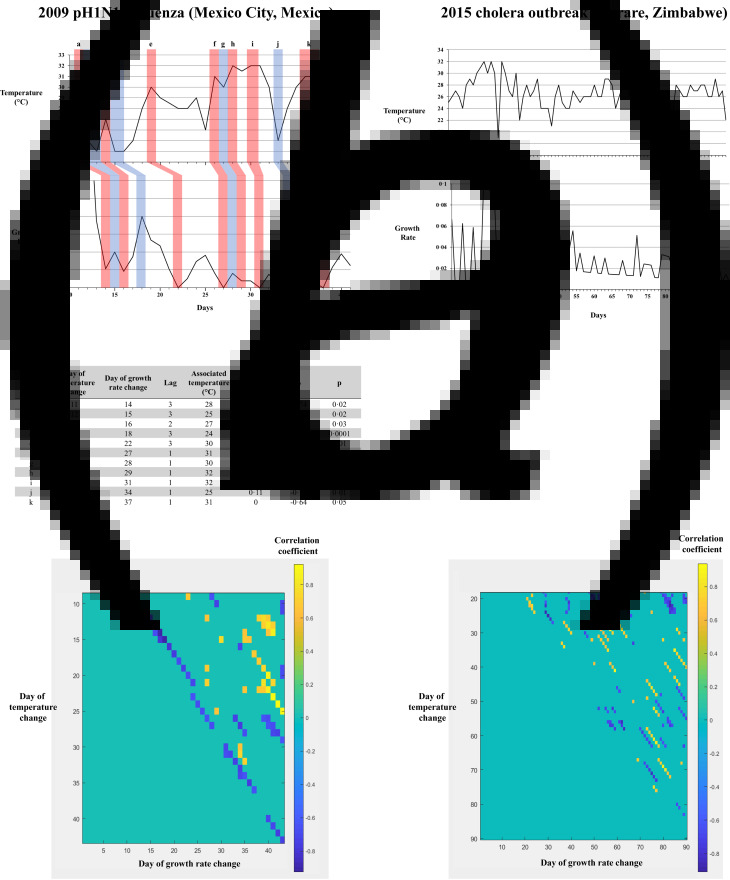
Fig. 1.
Day-to-day micro-correlation analysis validation, on the 2009 pH1N1 influenza outbreak in Mexico City, Mexico (positive control) and on the 2015 cholera outbreak in Harare, Zimbabwe. (a) Analysis of the pH1N1 outbreak in Mexico City shows negative-correlation sequences between temperature and growth rate, with a lag of 1−3 days. The generated matrix shows a long streak of negative correlation (in blue), with a lag considered to be constant. (b) Analysis of the cholera outbreak in Harare shows no evident correlation sequences. The generated matrix shows short streaks of negative (blue) and positive (orange) correlations, of various lag values (1−40 days), and seemingly randomly positioned.

