Figure 3.
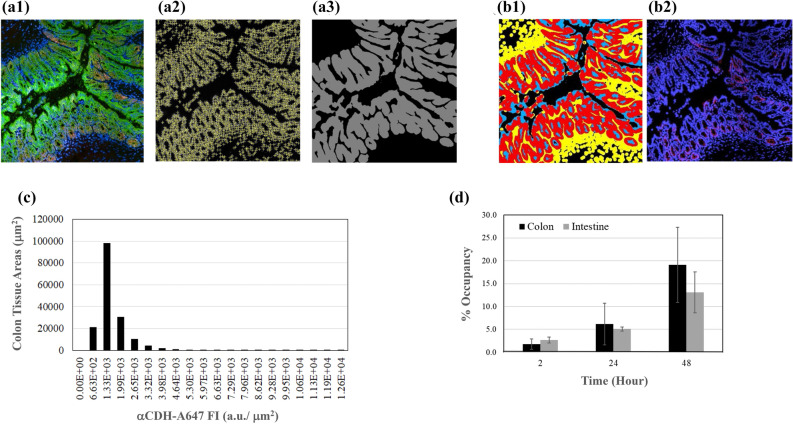
Example of applying U-Net models to determine drug biodistribution in production run. (a–c), a FOV on proximal section of colon tissue obtained from mouse dosed with 3 mg/Kg αCDH-A647 for 24 h. (a1) Full color image of the FOV acquired by HCS (red: αCDH-A647; green anti-EpCAM; blue: DAPI). (a2) Nuclei identified by a U-Net model (yellow cross). (a3) Epithelial region segmented by another U-Net model (grey color zone). (b1) Identification of nucleated epithelial region in the FOV—yellow: nuclear areas approximated from detected nuclei; blue: segmented epithelial regions; red: selected nucleated epithelial regions by overlapping yellow and blue. (b2) Image of αCDH-A647 (red) with nuclei (blue) in the FOV. (c) Histogram of αCDH-A647 biodistribution in the FOV was obtained by overlapping αCDH-A647 in (b2) with nucleated epithelial regions in (b1). (d) Time courses of αCDH-A647 occupancy in nucleated epithelial cells of the whole colon proximal and small intestine duodenum tissue sections.

