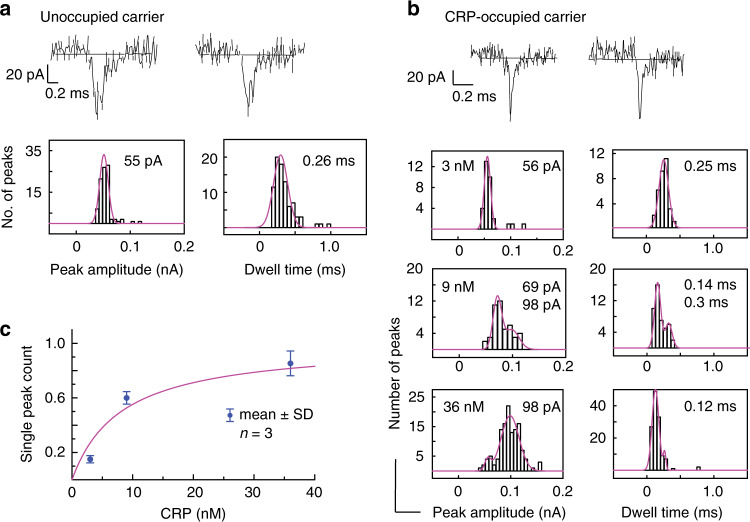
Fig. 4. CRP detection in diluted human plasma.
Typical ion current traces, and peak amplitude and dwell time histograms for a unoccupied carriers and b CRP-occupied carriers incubated in different concentrations of CRP in 5% plasma. c Normalised single peak count, i.e., ratio of single peaks vs total classified peaks against CRP concentration (Supplementary Tables 3 and 4). The solid line is a guide to the eye. The error bars are standard deviation calculated from three different traces (n = 3). The sampling time was 2 min for all samples. Source data are in the Source Data file.

