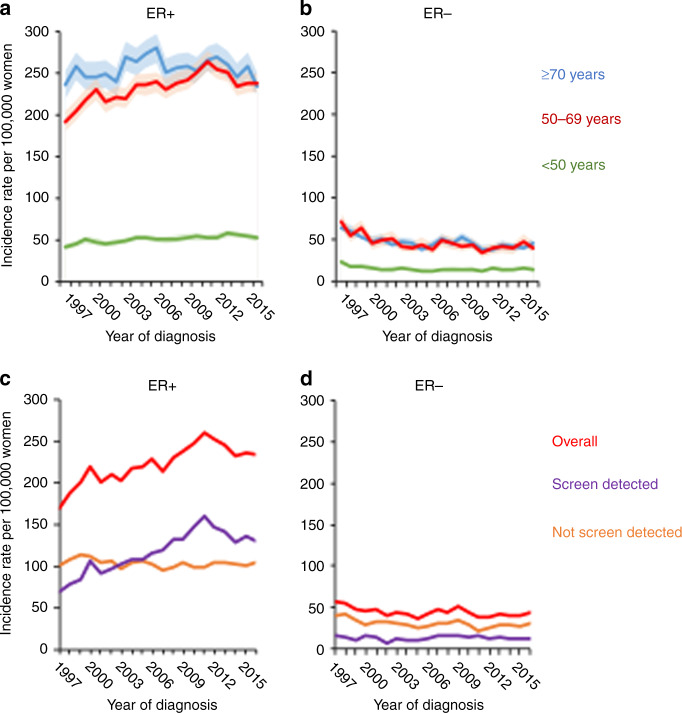
Fig. 2. Age-specific trends in breast cancer incidence stratified by age groups, screen detection and ER status in Scotland for 1997–2016.
ER-positive (a) and ER-negative (b) age-specific trends for age groups 20–49 (green), 50–69 (red) and 70 years old (blue). Shaded areas surrounding lines indicate 95% CI of rates. Panels c, d are restricted to women aged 50–69 years, and incidence rates overall (red), for screen-detected (purple) and not screen-detected (orange) are shown for ER+ (c) and ER− tumours (d).

