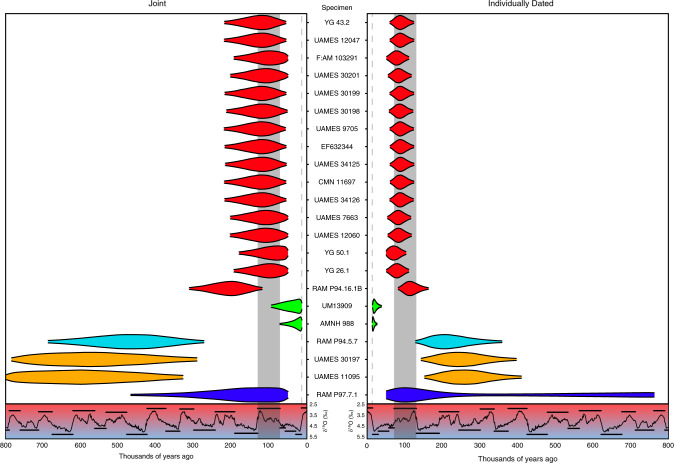
Fig. 3. Marginal posterior densities of specimen ages in molecular dating analyses.
Specimens are coloured by clade and arranged as in Fig. 1b. Each violin represents the 95% HPD interval of each specimen age estimated in the Joint (left) and Individually Dated (right) analyses. The δ18O record for the last 800 thousand years is overlaid below both plots and corresponds to the one in Fig. 2a, with the approximate extent of the MIS 5 interglacial shaded in grey. The dashed grey line at 13 kya represents the minimum bound imposed by the youngest specimen in the analyses.

