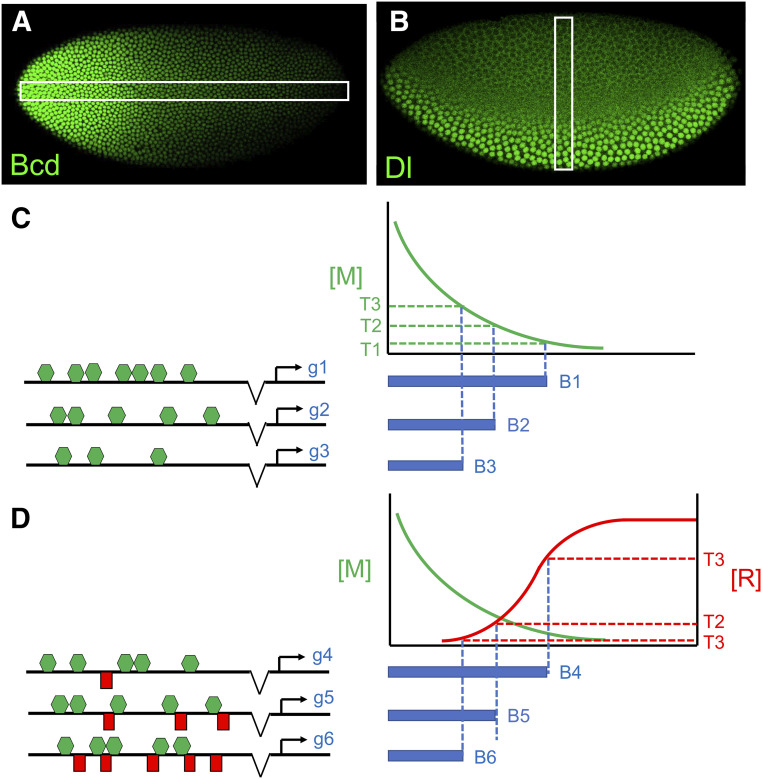
Figure 4.
Morphogen-mediated patterning mechanisms. (A and B) Immunofluorescence detection of the Bicoid (A) and Dorsal (B) transcription factors (TFs), which are distributed in concentration gradients and function as morphogens in the early fly embryo. (C and D) Two models for target-gene patterning. (C) The differential affinity model. Three hypothetical target genes (g1–g3) are shown. Each gene contains an enhancer with a different number of binding sites (green hexagons) for a TF that functions as an activating morphogen (M). The blue bar to the right of each gene represents its expression pattern, and each gene makes a threshold-dependent expression boundary at a position determined by the number of binding sites in its enhancer. All three enhancers are activated in regions with high levels of the morphogen. Enhancers containing more binding sites are bound by M and activated in regions with lower levels of morphogen. Differences in binding site affinity (not shown here) can also determine binding sensitivity and boundary positioning. (D) A combinatorial model that integrates opposing gradients of an activator (M) and a repressor (R). In this model, the enhancers associated with three genes (g4–g6) contain the same number (and affinity) of activator sites, but different numbers of repressor sites. In this model, boundary positions are determined by threshold concentrations of the repressor. Embryo images in (A) and (B) are courtesy of Pinar Onal and Christine Rushlow, respectively.

