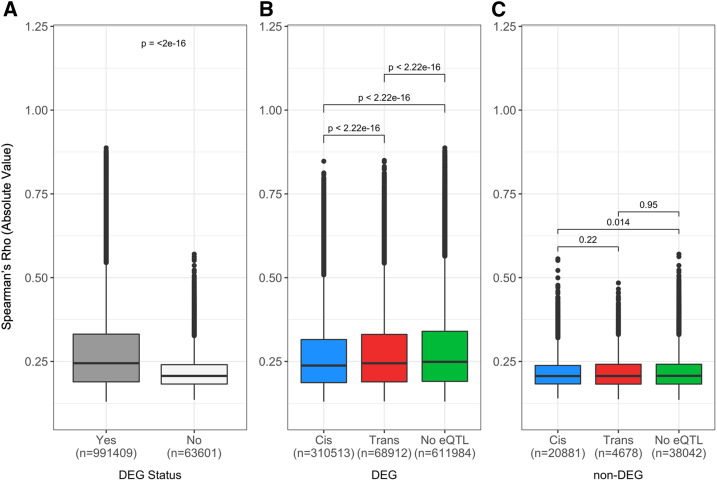
Figure 6.
Magnitude of correlation is similar between miRNA and mRNA with cis, trans, and no-eQTL and reduced when mRNA are not differentially expressed. Expression data were used to generate correlations between pairs of miRNA (n = 246) and mRNA (n = 24,004) and the results were filtered for false-discovery-rate-corrected significance (α ≤ 0.05), resulting in 1,424,040 significant correlations. miRNA-mRNA pairs were classified by their eQTL status in the additive model. A total of 1,055,010 eQTL with transcripts that passed the quality threshold for the DE analysis were included. (A) Spearman’s rho was plotted against the DE status of the mRNA from the additive genome model. Median ± SE for DEG and non-DEG include 0.245 ± 0.0001 and 0.207 ± 0.0002, respectively. (B and C) Spearman’s rho was plotted against the eQTL status of mRNA (B) that were differentially expressed by diet and (C) that were not differentially expressed by diet. For differentially expressed mRNA with cis, trans, and no-eQTL, the median ± SE are 0.238 ± 0.0002, 0.245 ± 0.0005, and 0.249 ± 0.001, respectively. For nondifferentially expressed mRNA with cis, trans, and no-eQTL, the median ±SE are 0.207 ± 0.003, 0.207 ± 0.0007, and 0.207 ± 0.002, respectively. DEG, Differentially Expresses Gene.

