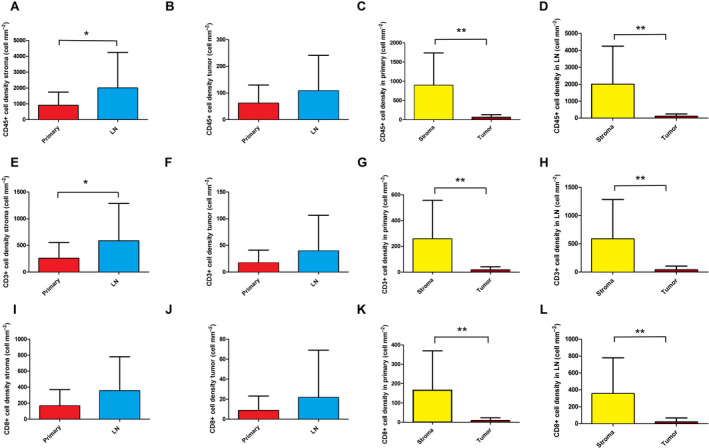
Fig. 2.

Immune cell distribution in primary SCLC tumors and matched LN metastases according to stroma and tumor nests. Significantly higher cell density was determined in the stroma of LN metastases compared to primary tumors, for CD45 (893.1 ± 159.4 vs 1993 ± 426.6 cell·mm−2, P = 0.049, n = 59, A), CD3 (258.5 ± 56.47 vs 585.4 ± 132.2 cell·mm−2, P = 0.033, n = 56, E), but not for CD8 (165.9 ± 38.46 vs 356.0 ± 80.07 cell·mm−2, P = 0.075, n = 58, I). Immune cell density showed no significant difference in tumor nests (tumor) in LN metastases compared to primary tumors, for CD45 (61.52 ± 13.21 vs 107.9 ± 26.25 cell·mm−2, P = 0,215,, n = 59, B), CD3 (17.13 ± 4.62 vs 39.50 ± 13.13 cell·mm−2, P = 0.251, n = 56, F), and CD8 (8.66 ± 2.78 vs 21.62 ± 9.295 cell·mm−2, P = 0.332, n = 58, J). Moreover, the stroma of primary tumors are significantly more infiltrated by major immune cells vs tumor nests, for CD45 (893.1 ± 159.4 vs 61.52 ± 13.21 cell·mm−2, P < 0.001, n = 31, C), CD3 (258.5 ± 56.47 vs 17.13 ± 4.62 cell·mm−2, P < 0.001, n = 29, G), and CD8 (165.9 ± 38.46 vs 8.67 ± 2.78 cell·mm−2, P < 0.001, n = 30, K). The stroma of LN metastases are significantly more infiltrated by major immune cells vs tumor nests, for CD45 (1993 ± 426.6 vs 107.9 ± 26.25 cell·mm−2, P < 0.001, n = 28, D), CD3 (585.4 ± 132.2 vs 39.50 ± 13.13 cell·mm−2, P = 0.002, n = 26, H), and CD8 (356.0 ± 80.07 vs 21.62 ± 9.295 cell·mm−2, P < 0.001, n = 28, L). Wilcoxon matched‐pair test was used to compare immune cell densities in the stromal vs intratumoral compartments. Mann–Whitney U‐test was used to compare immune cell densities in the stroma and tumor compartments of primary tumors vs LN metastases. Metric data were shown as mean and corresponding SEM, and graphs indicate the mean and corresponding 95% CI. Statistical significance *P < 0.05; **P < 0.01.
