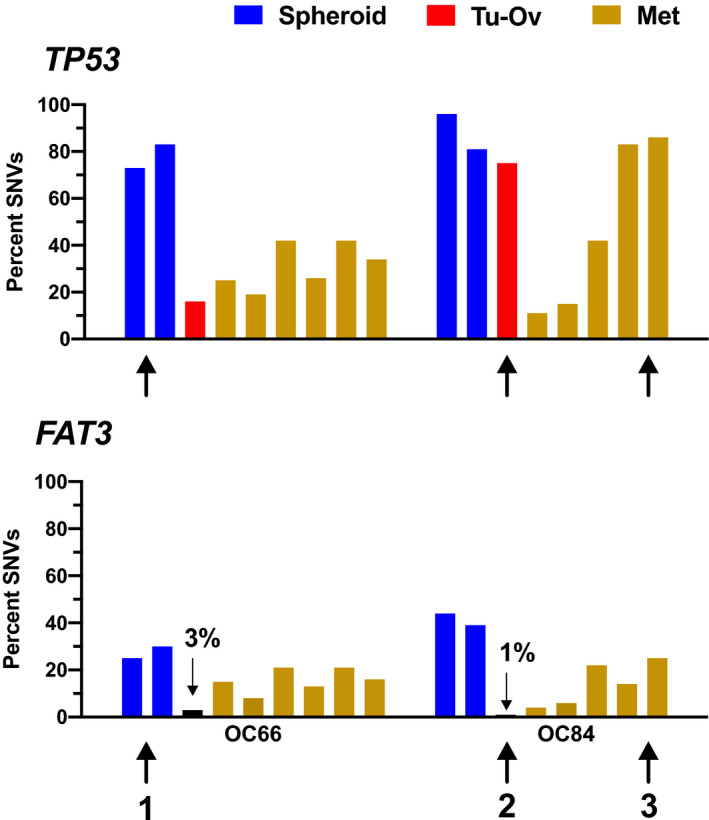
Fig. 2.

Single nucleotide variations (SNVs) in TP53 and FAT3 in tumor cells from different locations in four HGSC patients. Genetic loci were analyzed as in Fig. 1. The bar graph shows the percentage of SNVs in tumor cell spheroids from ascites (Sph; blue), lesions on ovaries or fallopian tubes suspected as primary sites (T‐Ov; red), and metastasis from different locations (Mets; dark yellow). Order of solid tumor samples from left to right is as in Table S1 (columns E/F). For frequencies < 5% the actual percentage is shown. Bars are aligned to allow for a direct comparison of SNV frequencies at different loci in the same sample. Black arrows point examples of strong differences between loci in the same sample. 1: TP53 versus FAT3 in spheroids (blue); 2: TP53 versus FAT3 in ovarian lesion (red); and 4: TP53 versus FAT3 in metastasis (dark yellow).
